UNESCO Institute for Statistics data for 2024 provide 79 country and territory observations for the adjusted gender parity index applied to the share of lower-secondary enrolment in private institutions. The median GPIA is 0.95419 and the simple mean is 0.95158. Only 14 observations fall within the commonly used 0.97–1.03 parity band, while 47 are below 0.97 and 18 are above 1.03.
This is not the percentage of girls among private-school students. The underlying statistic first asks what share of female lower-secondary enrolment is in private institutions and asks the same question for male enrolment. The adjusted gender parity index then compares those two percentages. A GPIA of 0.90 therefore does not mean that 90% of private-school students are boys, nor that 90% of girls attend private schools.
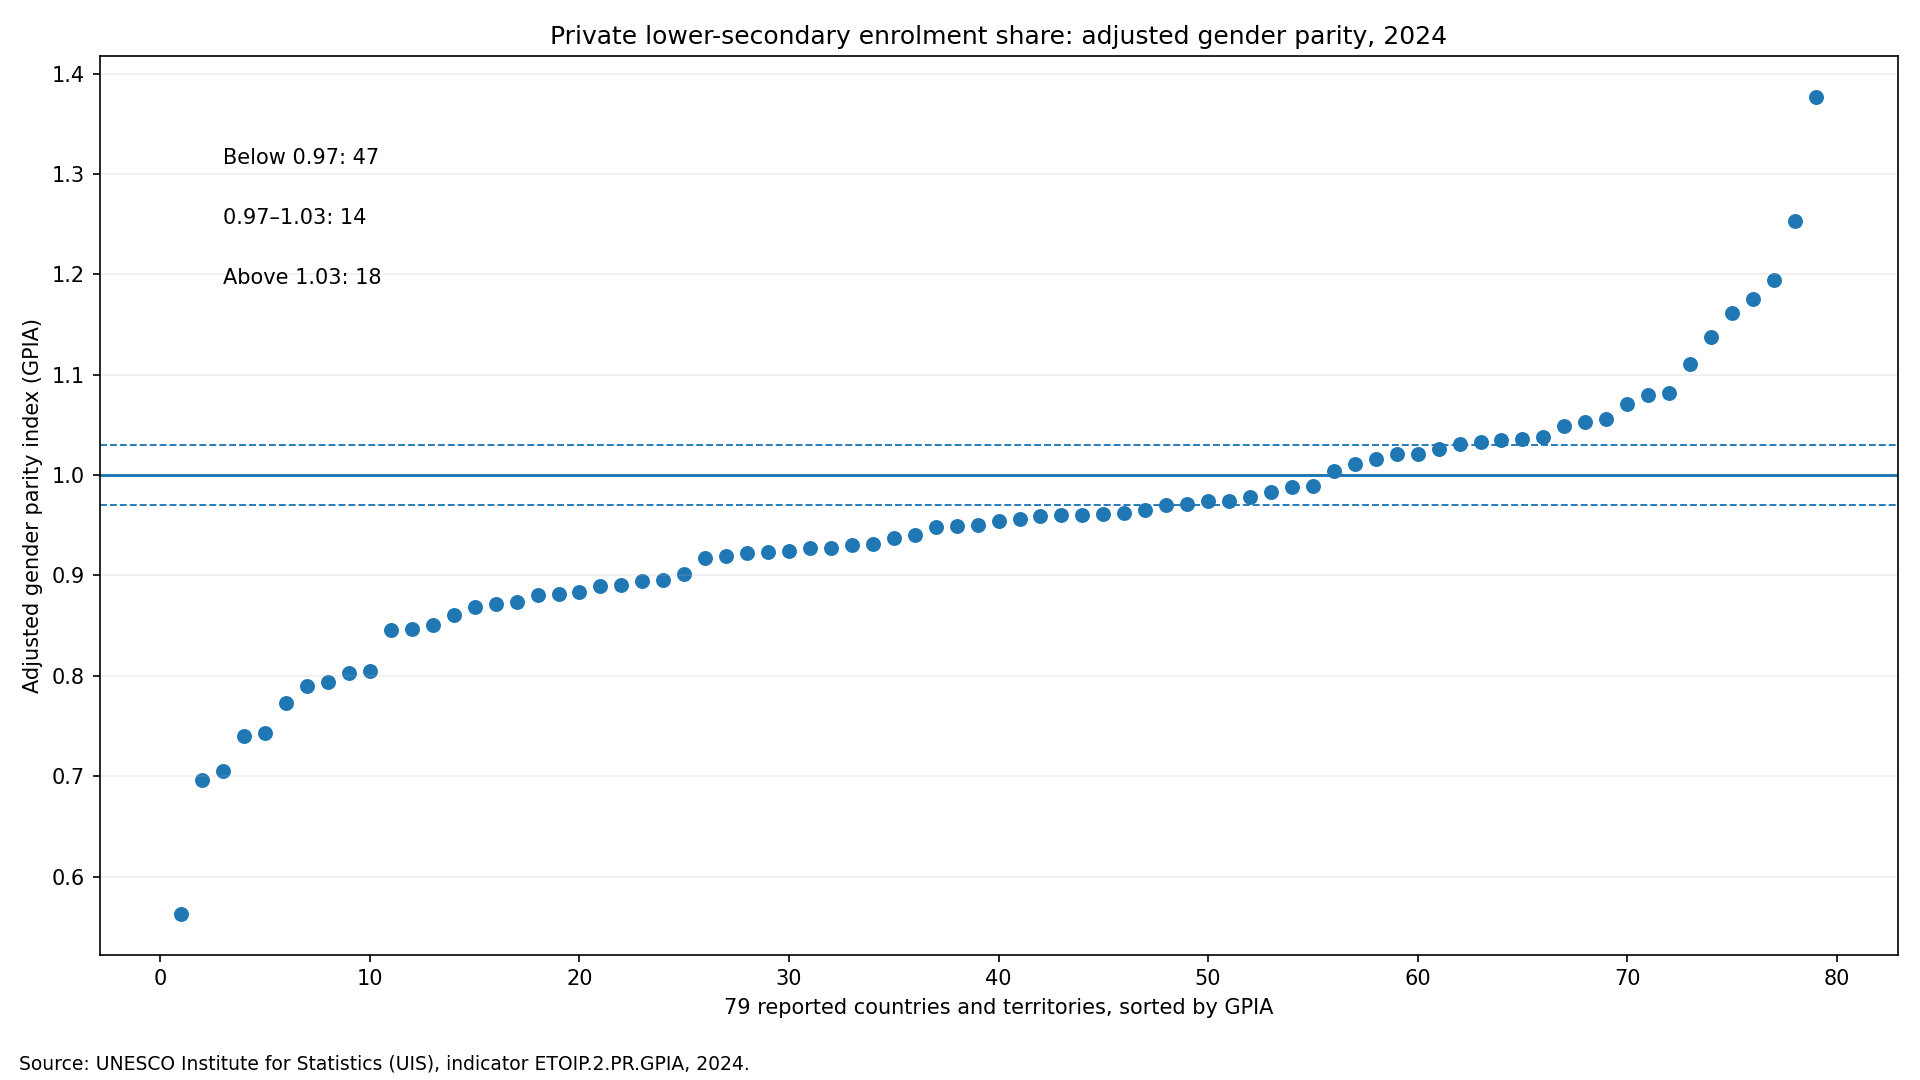
Table of Contents
The index compares two private-enrolment shares
The base indicator is the percentage of lower-secondary enrolment that is in private institutions. It is calculated separately for female and male students, and the parity index compares those two results. A conventional gender parity index uses the female value divided by the male value. Because that ratio is not symmetric around 1, UIS applies an adjusted transformation when the ratio exceeds 1.
A GPIA of 1 means the female and male private-enrolment shares are equal. Below 1, the female private-institution share is relatively lower; above 1, it is relatively higher. Neither direction should automatically be described as an educational advantage. The private share reflects how education is supplied and organized, not a performance score where a larger number is inherently better.
Fourteen of 79 observations were in the parity band
The 14 observations between 0.97 and 1.03 represent about 17.7% of the reported set. The 47 observations below 0.97 account for about 59.5%, and the 18 above 1.03 for about 22.8%. The distribution therefore leans below 1 among the countries and territories with data.
The first quartile is 0.88662 and the third quartile 1.02109. A wider 0.9–1.1 interval contains 48 observations. That broader range is not the UIS parity definition, but it helps show that many observations are fairly near 1 even though relatively few satisfy the narrower 0.97–1.03 benchmark.
Examples close to parity and farther from it
Brazil at 1.00360, Finland at 1.01079, Ecuador at 0.98915, and Slovakia at 0.98782 sit close to 1. Paraguay, the Cayman Islands, Sweden, El Salvador, the Dominican Republic, Saudi Arabia, Lebanon, and Lithuania are also around the parity band. These values indicate similar female and male private-institution shares, not a particular overall level of private education.
At the lower end, Uzbekistan records 0.56280, followed by China at 0.69655, Jordan at 0.70503, Israel at 0.74032, and South Sudan at 0.74285. At the upper end, Barbados reaches 1.37684, Bulgaria 1.25351, Luxembourg 1.19409, and Burkina Faso 1.17559. These are large directional differences in the underlying female and male percentages.
| Country or territory | Code | GPIA | Band |
|---|---|---|---|
| Lebanon | LBN | 0.97375 | 0.97–1.03 |
| Saudi Arabia | SAU | 0.97417 | 0.97–1.03 |
| Dominican Republic | DOM | 0.97820 | 0.97–1.03 |
| Cayman Islands | CYM | 0.98287 | 0.97–1.03 |
| Slovakia | SVK | 0.98782 | 0.97–1.03 |
| Ecuador | ECU | 0.98915 | 0.97–1.03 |
| Brazil | BRA | 1.00360 | 0.97–1.03 |
| Finland | FIN | 1.01079 | 0.97–1.03 |
| Paraguay | PRY | 1.01635 | 0.97–1.03 |
| Sweden | SWE | 1.02095 | 0.97–1.03 |
| El Salvador | SLV | 1.02124 | 0.97–1.03 |
| Lithuania | LTU | 1.02633 | 0.97–1.03 |
Values above 1 are adjusted rather than raw ratios
The distinction between a raw parity ratio and GPIA matters most above 1. When the female indicator value exceeds the male value, UIS transforms the ratio so that the scale is symmetric around the equality point. In practical terms, an adjusted value of 1.20 should not be read as saying the female percentage is exactly 1.20 times the male percentage.
The most useful reading is directional and distance-based. Values near 1 show similar female and male shares. Values far below 1 show a much lower female private-enrolment share relative to the male share, while values far above 1 show the opposite direction. The 0-to-2 adjusted range makes those deviations more comparable on the two sides.
Private-institution share is not the same as access to education
The denominator consists of students already enrolled at the lower-secondary level. The indicator then asks what percentage of each sex is enrolled in private institutions. It does not measure the proportion of all lower-secondary-age children who are in school, and it does not directly describe out-of-school rates, completion, learning outcomes, or progression.
Two systems could both have a GPIA near 1 even if one has 10% of both female and male enrolment in private institutions and another has 70% for both groups. Gender parity and the size of the private sector are therefore separate dimensions. To understand sector size, the sex-specific percentages or the both-sexes private-enrolment share are needed.
The reverse can also happen: a small private sector can still produce a GPIA far from 1 if the female and male percentages differ substantially in relative terms. That is why parity indices are most informative when read beside the underlying percentages rather than treated as a complete description of the education system.
A private-sector parity index is not the mirror image of the public-sector index
If public and private institutions fully exhaust the categories, the underlying shares are complements. But the parity indices are ratios built from sex-specific percentages and then adjusted around 1. As a result, a private-sector GPIA and a public-sector GPIA are not simple numerical opposites.
Institutional definitions can also differ across education systems. UIS provides an internationally comparable classification, but a GPIA alone cannot explain whether a country’s private institutions are fully independent, publicly subsidized, faith-based, nonprofit, or part of another national arrangement. Those questions require country-specific institutional data.
Lower secondary should also be distinguished from secondary education as a whole and from upper secondary. The private share can change across stages, and the gender relationship can change with it. Articles using ETOIP.2T3.PR.GPIA or ETOIP.3.PR.GPIA therefore answer related but different questions.
All 79 reported observations use the same year
Every row in this dataset is dated 2024, so the comparison does not mix different latest available years. That removes one common source of distortion in cross-country tables. However, 79 reported observations do not constitute universal coverage. Many national units in the UIS catalogue do not have a published value for this indicator.
There are no missing values or official zero values inside the 79-row dataset used here. Countries without a reported observation remain outside the calculations rather than being assigned zero. The mean, median, quartiles, and parity counts therefore describe the reported set, not the entire world.
A single common year also cannot show whether disparities are narrowing or widening. Trend analysis requires repeated observations for a stable set of countries and attention to gaps in national reporting. The 2024 cross-section is best used to describe the distribution at one point in time.
Source and calculation notes
The source is the UNESCO Institute for Statistics indicator ETOIP.2.PR.GPIA for 2024. Published GPIA values are used directly, without interpolation or imputation. Summary statistics and parity-band counts are calculated from the 79 official numeric observations.
UIS explains that adjusted parity indices are symmetric around 1 and bounded between 0 and 2. Values from 0.97 to 1.03 are commonly interpreted as parity. For this particular underlying indicator, the analysis treats departures from 1 as differences in the private-enrolment share by sex, not as a ranking of educational quality.
Frequently Asked Questions
What does a GPIA of 1 mean for this indicator?
It means the female and male percentages of lower-secondary enrolment in private institutions are equal. UIS commonly uses 0.97–1.03 as the parity band.
Does a GPIA of 0.90 mean 90% of private-school students are female?
No. GPIA is an adjusted comparison of female and male private-enrolment shares, not a student composition percentage.
Are all 79 observations from 2024?
Yes. All numeric observations used in this comparison are dated 2024, and unreported national units are not filled with zero.
Related Articles
Green Map creates custom-edited map images using open geographic data sources such as geoBoundaries, Natural Earth, OpenStreetMap, and government open data. These maps are edited visual materials, not raw data files, and are provided for education, documents, presentations, and graphic reference.