Eurostat’s 2025 enterprise technology data show a wide spread in the reported use of AI speech-recognition tools across 31 European reporting countries. The measure is narrow and specific: it counts enterprises with at least 10 persons employed that use AI technologies to convert spoken language into a machine-readable format. Denmark records the highest share at 15.17%, followed by Finland at 14.80%, Luxembourg at 13.02%, Belgium at 12.29%, and the Netherlands at 11.61%. Poland is lowest at 1.59%, while Romania, Türkiye, Serbia, Bulgaria, and Albania are also below 3%.
Across all 31 observations, the simple mean is 6.53% and the median is 4.68%. The gap between those two summary measures is informative. The upper tail contains several countries above 10%, which pulls the mean upward, while the middle country in the ordered distribution is only 4.68%. The first quartile is 3.55% and the third quartile is 9.87%, so half of the observations fall between those two points. The full maximum-to-minimum spread is 13.58 percentage points.
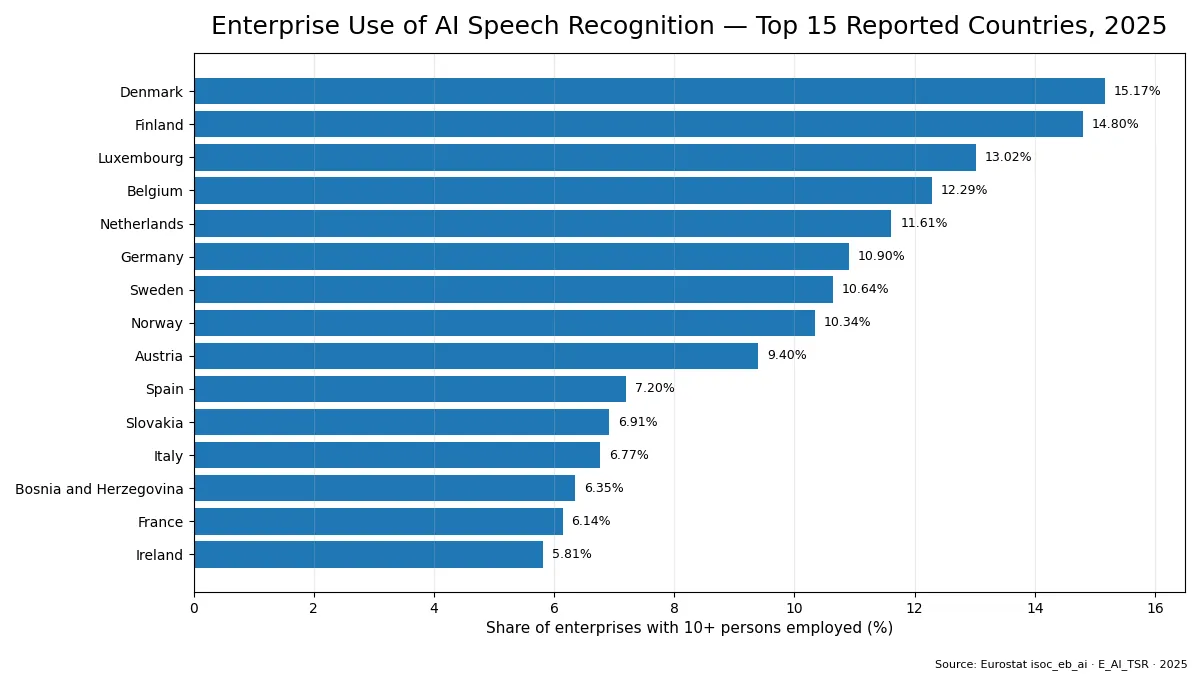
Table of Contents
What the indicator measures — and what it does not
This is not a general AI-adoption rate. An enterprise may use machine learning, image recognition, generative AI, robotic process automation, or another AI function and still be outside this particular indicator if it does not use the speech-recognition function defined by Eurostat. Conversely, an enterprise counted here only needs to meet the survey definition for this specific technology. Treating the percentage as an all-purpose measure of corporate AI maturity would therefore overstate what the data can support.
The denominator also matters. Eurostat’s GE10 size class limits the comparison to enterprises with 10 or more persons employed, and PC_ENT expresses the result as a percentage of enterprises. It is not a percentage of workers, revenue, transactions, customer calls, or working hours. A country can therefore post a high value even if speech recognition is concentrated in a subset of firms, and a low value does not imply that individuals or very small businesses rarely use voice-enabled technology.
The highest values form a distinct upper tier
Eight countries are at or above 10%: Denmark, Finland, Luxembourg, Belgium, the Netherlands, Germany, Sweden, and Norway. The four Nordic observations in that set—Denmark, Finland, Sweden, and Norway—average 12.74%, while Belgium, the Netherlands, and Luxembourg average 12.31%. Those calculations describe the geography of the 2025 values; they do not establish a common cause. Industry composition, firm size, digital services, language technology, and business-process design would all need separate evidence before any causal explanation could be made.
Austria, at 9.40%, sits just below the 10% threshold. Spain follows at 7.20%, then Slovakia at 6.91%, Italy at 6.77%, Bosnia and Herzegovina at 6.35%, France at 6.14%, and Ireland at 5.81%. This middle-high group is useful because it shows that the distribution is not simply divided into a high-adoption northwestern block and a low-adoption remainder. Several countries occupy intermediate positions, and differences within that group are often small.
Why the median tells a different story from the mean
The mean of 6.53% is 1.85 percentage points above the median. That happens because the data are right-skewed: a relatively small number of high values extend far above the middle of the distribution. The median observation is Estonia at 4.68%. If a reader used only the mean, the “typical” country could look more AI-intensive than the actual midpoint of the 31-country ranking. Reporting both measures avoids that distortion.
A threshold view makes the shape clearer. There are 8 countries at 10% or more, 7 from 5% to under 10%, 10 from 3% to under 5%, and 6 below 3%. The largest band is the 3–5% group with ten countries. The top eight average 12.35%, compared with 2.66% for the bottom eight, a ratio of roughly 4.6 to one. That is a substantial descriptive gap even though it should not be treated as a measure of productivity or competitiveness.
The middle of the ranking is densely packed
Estonia at 4.68%, Slovenia at 4.50%, Croatia at 4.42%, and Malta at 4.41% illustrate how tightly clustered the middle can be. Lithuania is 4.26%, Portugal 3.96%, Latvia 3.92%, Czechia 3.57%, Hungary 3.53%, and Cyprus 3.20%. A few ranking positions can therefore be separated by only a few tenths of a percentage point. Visual maps or league tables can make those differences look more dramatic than they are, especially when a color scale stretches across the full 1.59–15.17% range.
For practical interpretation, it is better to think in broad bands rather than to overemphasize every ordinal position. Countries around 4% are meaningfully below the upper tier above 10%, but the difference between 4.42% and 4.50% should not be treated as evidence of a different level of technological capability. Survey estimates can also be affected by sampling and reporting conventions, so tiny gaps deserve particular caution.
The bottom six are not all equally low
Six countries fall below 3%. Albania is 2.70%, Bulgaria 2.67%, Serbia 2.66%, and Türkiye 2.64%, forming a remarkably tight cluster. Romania is lower at 2.31%, and Poland is separated further at 1.59%. Calling all six simply “the lowest countries” hides this structure. Four are effectively grouped around 2.6–2.7%, while the two lowest observations form a separate lower step.
The same limitation applies to the meaning of a low percentage. It does not tell us how often people use voice assistants, whether public agencies deploy speech transcription, how many employees use AI features embedded in office software, or whether micro-enterprises adopt similar tools. It only describes the share of enterprises inside Eurostat’s specified population that report using this specific AI technology.
All 31 reported country values for 2025
The table below keeps the source year and indicator constant and sorts the 31 observations from highest to lowest. Values are shown to two decimal places. The ranking is a convenient reading aid, not an overall score of national AI performance.
| Rank | Country | Share of enterprises |
|---|---|---|
| 1 | Denmark | 15.17% |
| 2 | Finland | 14.80% |
| 3 | Luxembourg | 13.02% |
| 4 | Belgium | 12.29% |
| 5 | Netherlands | 11.61% |
| 6 | Germany | 10.90% |
| 7 | Sweden | 10.64% |
| 8 | Norway | 10.34% |
| 9 | Austria | 9.40% |
| 10 | Spain | 7.20% |
| 11 | Slovakia | 6.91% |
| 12 | Italy | 6.77% |
| 13 | Bosnia and Herzegovina | 6.35% |
| 14 | France | 6.14% |
| 15 | Ireland | 5.81% |
| 16 | Estonia | 4.68% |
| 17 | Slovenia | 4.50% |
| 18 | Croatia | 4.42% |
| 19 | Malta | 4.41% |
| 20 | Lithuania | 4.26% |
| 21 | Portugal | 3.96% |
| 22 | Latvia | 3.92% |
| 23 | Czechia | 3.57% |
| 24 | Hungary | 3.53% |
| 25 | Cyprus | 3.20% |
| 26 | Albania | 2.70% |
| 27 | Bulgaria | 2.67% |
| 28 | Serbia | 2.66% |
| 29 | Türkiye | 2.64% |
| 30 | Romania | 2.31% |
| 31 | Poland | 1.59% |
How to use this comparison responsibly
The data are most useful as a cross-sectional snapshot of where enterprise speech-recognition use stood in 2025. They can support questions about dispersion, clusters, and which reporting countries are above or below the midpoint. They cannot, by themselves, show whether adoption is accelerating. A trend statement would require comparable earlier years using the same indicator, enterprise-size definition, and sector coverage.
They also do not identify the mechanisms behind the differences. Customer-service automation, transcription workflows, accessibility tools, multilingual support, call analytics, and voice-controlled interfaces are all plausible use cases, but this dataset does not break adoption down by use case. Likewise, it does not establish whether higher adoption produces better business outcomes. The strongest conclusion is descriptive: enterprise use of AI speech recognition in 2025 was much more common in a small upper group than in the middle and lower parts of the 31-country sample.
Source and indicator definition
The primary source is Eurostat isoc_eb_ai for annual 2025 observations. The E_AI_TSR indicator is combined with enterprise size GE10 and unit PC_ENT: it measures the percentage of enterprises with at least 10 persons employed that use AI technologies converting spoken language into machine-readable form. Sector coverage follows Eurostat’s C10-S951_X_K aggregate.
Frequently Asked Questions
Which country has the highest reported enterprise use of AI speech recognition in 2025?
Denmark is highest at 15.17%, followed by Finland at 14.80% and Luxembourg at 13.02% among the 31 reporting countries.
Is this the overall percentage of enterprises using any type of AI?
No. It covers a specific technology: AI that converts spoken language into a machine-readable format.
Why is the 6.53% mean higher than the 4.68% median?
Several observations above 10% create a long upper tail and pull the simple mean above the midpoint of the ordered distribution.
Does the comparison represent every European country?
No. It compares the 31 countries with validated 2025 observations in this Eurostat extract and should not be presented as complete coverage of all European countries.
Related Articles
Green Map creates custom-edited map images using open geographic data sources such as geoBoundaries, Natural Earth, OpenStreetMap, and government open data. These maps are edited visual materials, not raw data files, and are provided for education, documents, presentations, and graphic reference.