Unemployment by education level is easy to misread unless the denominator is clear. The 2023 World Bank indicator used here measures unemployment within the labor force that has a basic level of education. It is not the share of all adults with basic education who are unemployed, and it is not the share of all unemployed people who have basic education. In the World Bank description, basic education covers primary or lower-secondary education under ISCED 2011. The indicator therefore asks a narrower question: among people with this education level who are in the labor force, what percentage are unemployed?
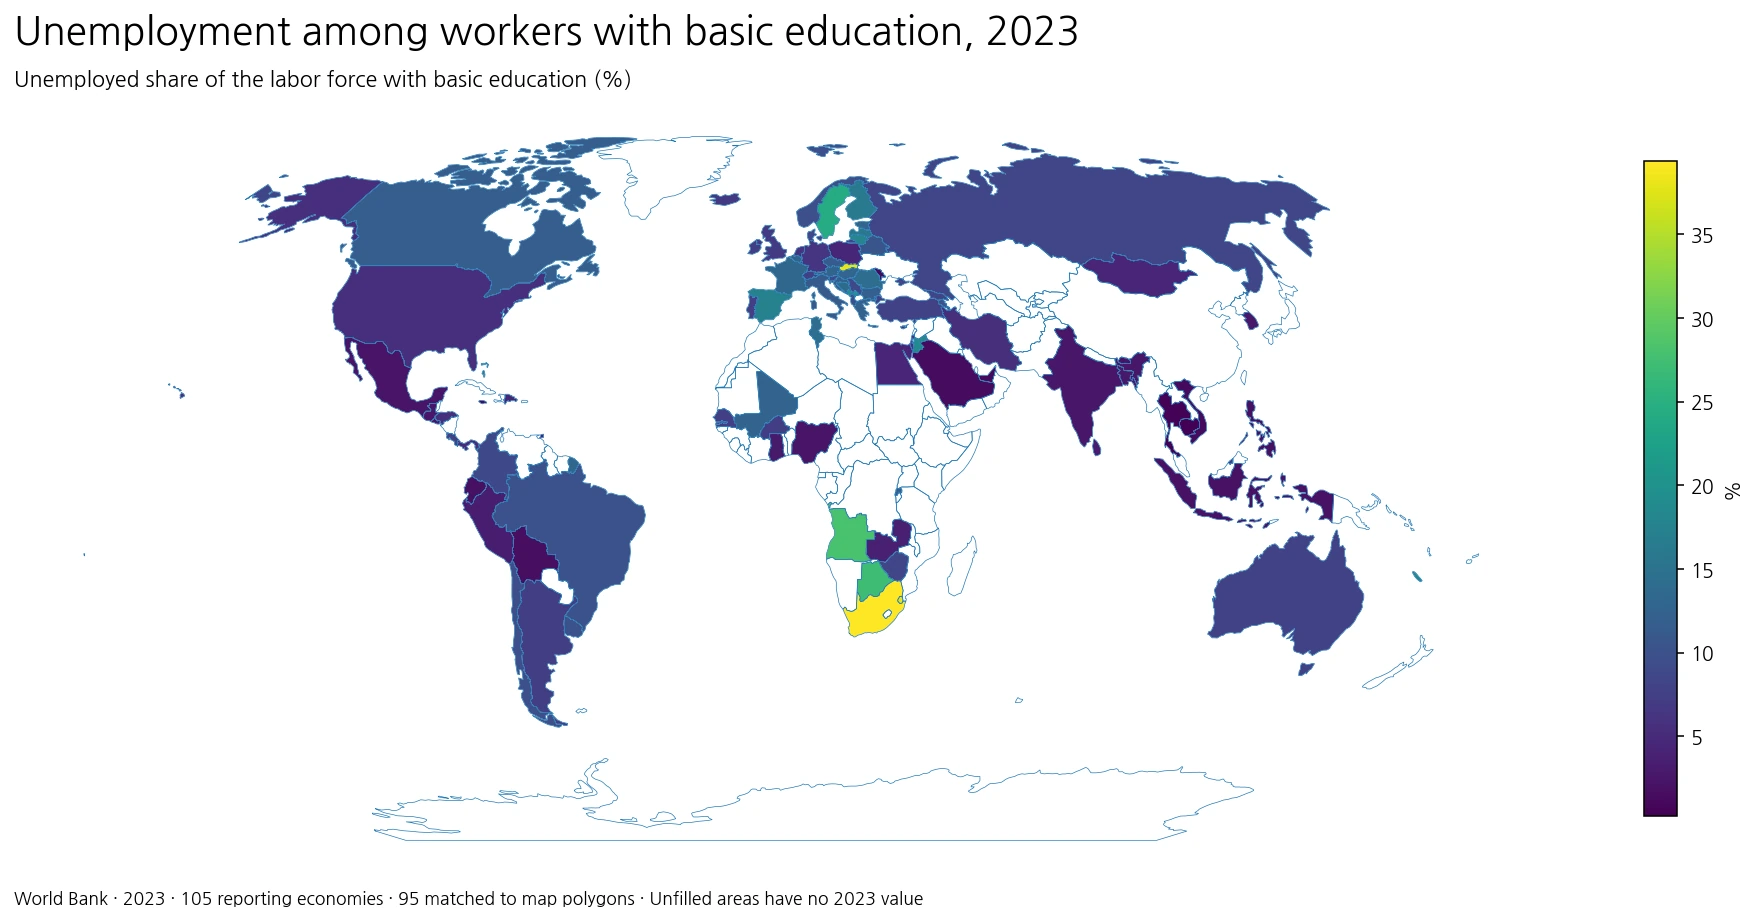
Table of Contents
The 2023 dataset contains 105 reported values
The country-and-economy master contains 217 entries after regional aggregates are excluded. A 2023 observation is available for 105 economies, while 112 have no value for this year. Missing observations remain missing; they are not treated as zero. An unfilled polygon on the map therefore indicates unavailable 2023 data rather than zero unemployment among people with basic education. The list includes separately reported economies and territories, so the count should not be interpreted as a count of sovereign states.
Across the 105 reported values, the simple mean is 9.14% and the median is 7.39%. The first quartile is 3.69% and the third quartile is 11.98%, which places the middle half of observations between roughly 3.7% and 12.0%. The 10th percentile is 1.96% and the 90th percentile is 17.76%. The mean sits above the median because several high observations stretch the upper tail. For a quick benchmark, the median and interquartile range are therefore more representative than the mean alone.
South Africa, the Slovak Republic and Eswatini are near 38–39%
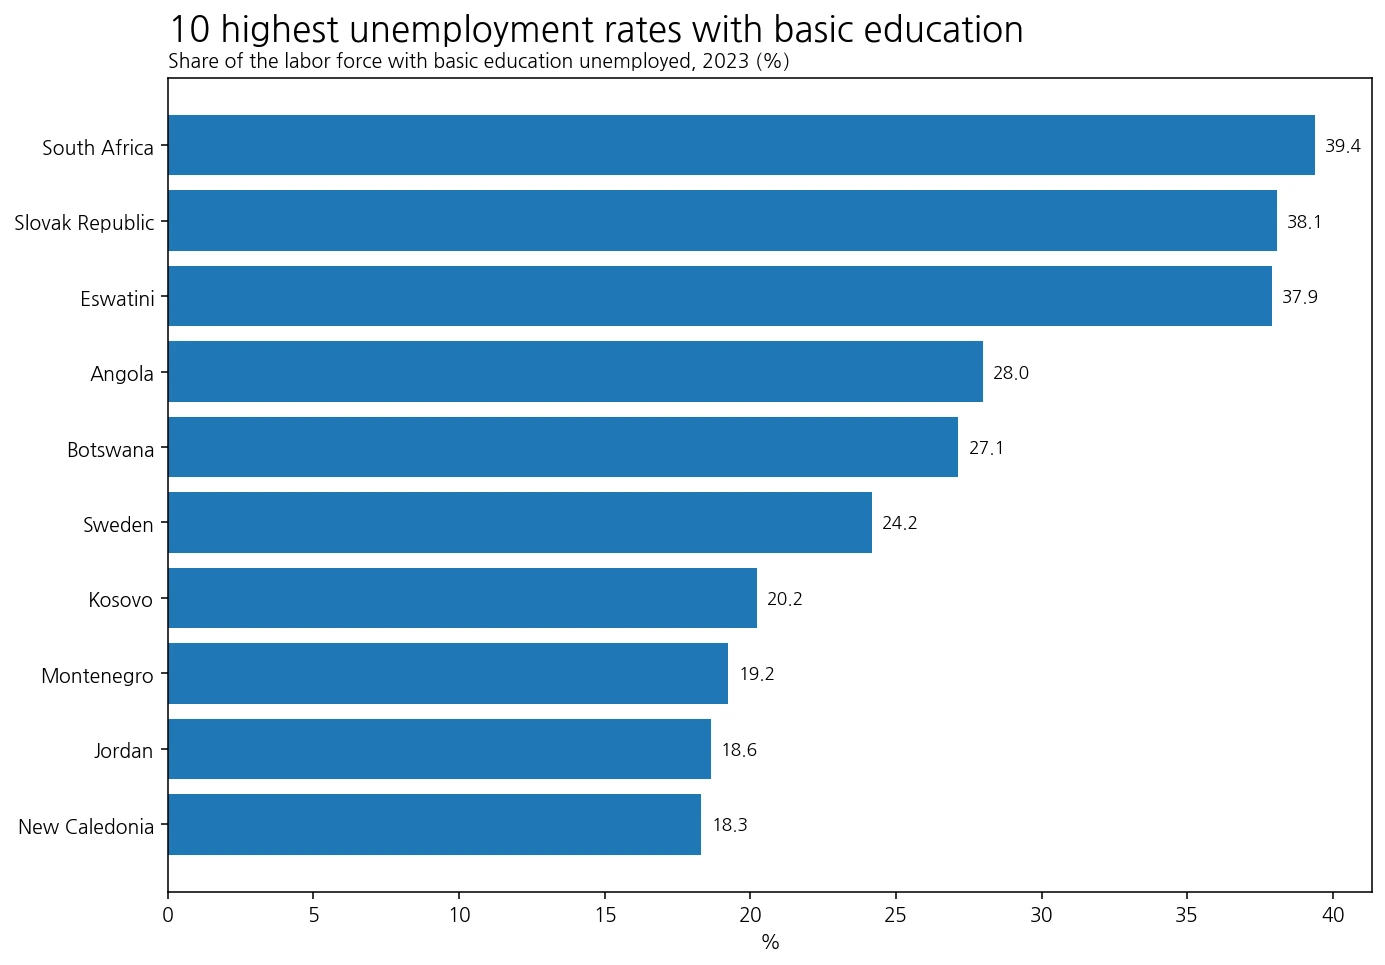
South Africa has the highest reported value at 39.378%. The Slovak Republic follows at 38.094%, and Eswatini is close behind at 37.911%. Angola is 27.992%, Botswana 27.148% and Sweden 24.175%. Kosovo records 20.219%, Montenegro 19.236%, Jordan 18.633% and New Caledonia 18.323%. The top ten are spread across southern Africa, Europe, the Middle East and the Pacific rather than forming one universal regional pattern.
| Economy | Unemployment with basic education, 2023 |
|---|---|
| South Africa | 39.4% |
| Slovak Republic | 38.1% |
| Eswatini | 37.9% |
| Angola | 28.0% |
| Botswana | 27.1% |
| Sweden | 24.2% |
| Kosovo | 20.2% |
| Montenegro | 19.2% |
| Jordan | 18.6% |
| New Caledonia | 18.3% |
These high percentages should not be converted into a claim that basic education itself causes unemployment. The indicator divides the labor force by education level and reports the unemployment rate within one group. It does not identify why that rate is high. Overall labor-market conditions, the occupational mix, participation patterns, the age profile of workers and many other factors may differ across economies. A cross-sectional map can locate unusually high values, but causal interpretation requires additional indicators and country-level evidence.
Southern Africa contains a cluster of high values, but not a uniform one
Southern Africa stands out on the map. South Africa is 39.4%, Eswatini 37.9% and Botswana 27.1%; Angola, farther north, is also high at 28.0%. Yet Zimbabwe is 8.5%, much closer to the overall median. That contrast is important because it prevents the regional cluster from being mistaken for a single common outcome. Neighboring or nearby economies can have very different unemployment rates within the same education group.
The map is most useful here as a guide to follow-up questions. In the high-rate economies, an analyst would want to compare total unemployment, labor-force participation, unemployment among intermediate and advanced education groups, and age-specific labor outcomes. If all education groups have high unemployment, the explanation is different from a case where unemployment is concentrated mainly among workers with basic education. This series alone cannot make that distinction.
Europe shows some of the largest neighboring contrasts
The Slovak Republic is the second-highest observation at 38.1%, while Czechia is 11.3%, Poland 4.4%, Hungary 12.8%, Austria 12.7% and Romania 14.3%. Northern Europe also varies sharply: Sweden is 24.2%, Finland 16.3%, Norway 9.5%, Denmark 8.7% and Iceland 6.7%. These differences show why a continental average would hide much of the relevant information.
Southern and western Europe are also mixed. Spain reports 17.3%, France 13.2%, Italy 11.3%, Greece 12.2% and Portugal 7.4%. The values do not support a simple “Europe is high” or “Europe is low” description. A more useful interpretation is that the unemployment experience of the basic-education labor force differs substantially across national labor markets, even among geographically close economies.
Several Southeast Asian economies are at the very low end
Cambodia has the lowest reported value at 0.259%, followed by Thailand at 0.462%. The United Arab Emirates is 1.232%, Moldova 1.244%, Viet Nam 1.253%, Saudi Arabia 1.340%, Jamaica 1.389%, Tonga 1.621%, Bolivia 1.770% and Ecuador 1.886%. The Philippines is also low at 1.892%, while Indonesia is 2.051%. This produces a visible low-value band across several reporting economies in Southeast Asia.
| Economy | Unemployment with basic education, 2023 |
|---|---|
| Cambodia | 0.3% |
| Thailand | 0.5% |
| United Arab Emirates | 1.2% |
| Moldova | 1.2% |
| Viet Nam | 1.3% |
| Saudi Arabia | 1.3% |
| Jamaica | 1.4% |
| Tonga | 1.6% |
| Bolivia | 1.8% |
| Ecuador | 1.9% |
A very low unemployment rate does not automatically mean that people with basic education have secure or high-quality jobs. Unemployment rates cover people without work who are available for work and seeking work under the relevant statistical definition. People outside the labor force are not counted as unemployed, and employment itself can include a wide range of working arrangements. Labor-force participation, employment quality, informality, wages and hours are therefore necessary companions when interpreting very low values.
The Middle East and Latin America show large within-region gaps
Jordan is 18.6%, placing it among the ten highest observations, while the United Arab Emirates is 1.2% and Saudi Arabia 1.3%. The gap is large despite all three being in the same broad region. Latin America also spans a wide range: Bolivia is 1.8%, Ecuador 1.9%, Guatemala 2.6% and Peru 3.4%, whereas Argentina is 7.2%, Colombia 8.8%, Chile 9.4% and Brazil 10.0%.
These contrasts are a reminder that spatial proximity is not an explanation. Education systems, labor-market institutions, economic cycles, participation behavior and the composition of workers can vary sharply from one country to another. The 2023 map is a snapshot, so it cannot show whether a gap is persistent or temporary. A time series would be needed to determine whether the same economies remain high or low across several years.
What “basic education” and “labor force” mean matters for the comparison
The World Bank description defines basic education as primary education or lower-secondary education according to ISCED 2011. ISCED provides a common international framework, which makes cross-country comparison more coherent than relying only on local school names or grade structures. Even so, national education systems are not identical, and the indicator should be read as a harmonized statistical category rather than as proof that every credential is perfectly equivalent.
The denominator is equally important. The rate is calculated within the labor force with basic education, not within everyone who has that education. People who are not participating in the labor market are outside the unemployment-rate denominator. Two economies can therefore have the same unemployment rate for this group while having very different participation rates or employment-to-population ratios. This is why unemployment and labor-force participation should be read together.
What the indicator can and cannot tell you
The indicator can show where unemployment within the basic-education labor force is unusually high or low in a common year. It can also be compared with unemployment rates for intermediate or advanced education to reveal whether unemployment is concentrated at one education level. It cannot, by itself, establish the return to education, the quality of jobs held by employed workers, the reason a person is unemployed, or the effect of a particular education policy.
For a fuller labor-market profile, useful companion measures include total unemployment, labor-force participation, employment-to-population ratios, youth unemployment, unemployment by other education levels, wages, informality and working hours. When these measures move together, they can provide a more coherent picture. When they diverge, the differences can identify where a simple headline unemployment rate is hiding important labor-market structure.
Five checks for reading the 2023 map
- The denominator is the labor force with basic education, not the entire population with basic education.
- Basic education covers primary or lower-secondary education under the ISCED 2011 definition used by the indicator.
- The 112 missing economies remain missing; an unfilled area is not a zero.
- Large gaps, the 7.4% median and the 3.7–12.0% interquartile range are more informative than tiny rank differences.
- High or low values should be compared with total unemployment, participation and unemployment at other education levels before drawing broader conclusions.
With those checks in place, both ends of the distribution become easier to interpret. South Africa, the Slovak Republic and Eswatini are genuine high observations in the 2023 data, while Cambodia and Thailand are genuine low observations. The map accurately shows that contrast, but it does not explain it. The next analytical step is to bring in other labor-market measures rather than treating the map as a ranking of education systems or policy performance.
Source and calculation method
The values come from the World Bank indicator “Unemployment with basic education (% of total labor force with basic education)”, code SL.UEM.BASC.ZS, using the 2023 observation year. The official description states that basic education comprises primary or lower-secondary education under ISCED 2011. Regional aggregates were excluded. Of 217 country-and-economy entries, 105 have a reported 2023 value and 112 remain missing. Mean, median, quartiles, percentiles and rankings were calculated directly from the 105 reported observations without imputing missing values.
This is a cross-sectional comparison for one year. It does not show whether an economy improved from 2022, whether a high value is persistent, or whether a methodological break occurred. Those questions require a time series and national metadata. Keeping a single year fixed avoids mixing observations from different periods and makes the geographic comparison internally consistent.
Frequently Asked Questions
Who is in the denominator of this unemployment rate?
The denominator is the labor force with basic education, not everyone with basic education. The rate measures the unemployed share within that labor-force group.
What does basic education mean in this indicator?
The World Bank description defines basic education as primary or lower-secondary education according to ISCED 2011.
Do unfilled countries on the map have 0% unemployment?
No. They have no 2023 observation in this comparison. Missing values were preserved rather than replaced with zero.
Related Articles
Green Map creates custom-edited map images using open geographic data sources such as geoBoundaries, Natural Earth, OpenStreetMap, and government open data. These maps are edited visual materials, not raw data files, and are provided for education, documents, presentations, and graphic reference.