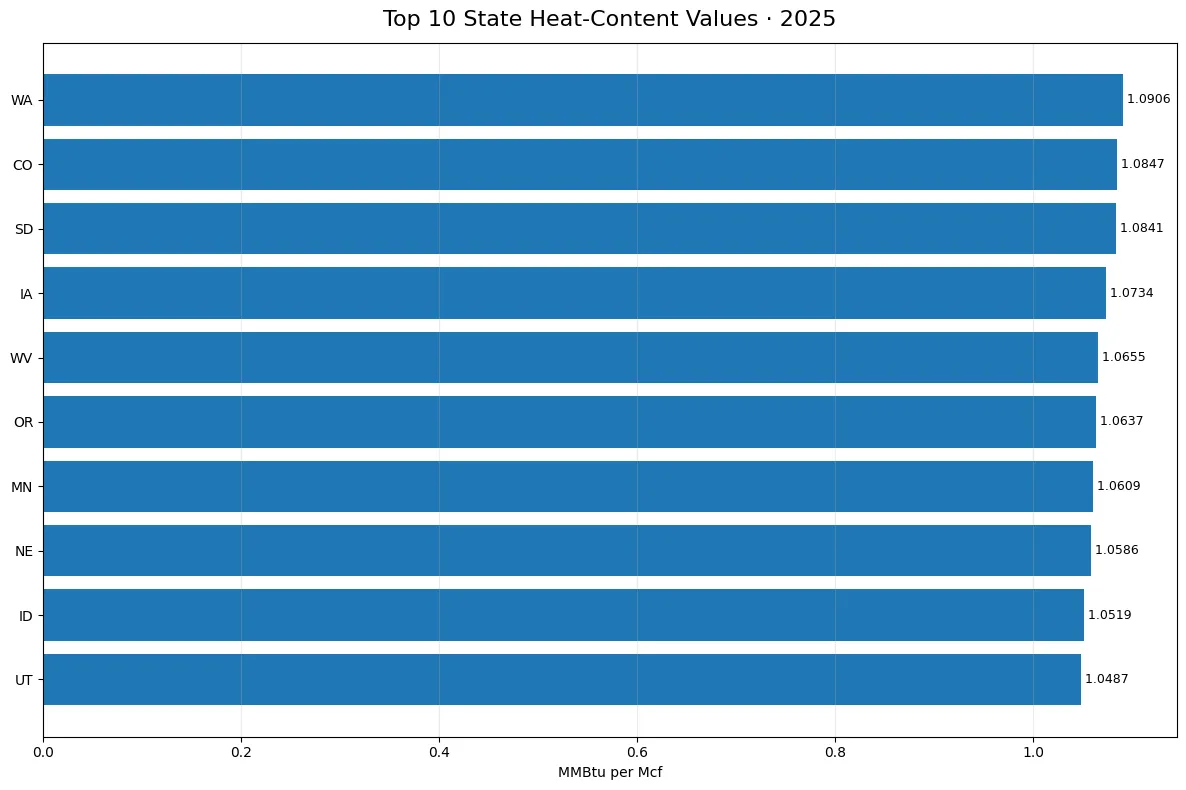
Washington recorded the highest 2025 state-level heat-content value for EIA’s Natural Gas & Other Gases category at 1.0906 MMBtu per Mcf. Colorado followed at 1.0847, South Dakota at 1.0841, and Iowa at 1.0734. The comparison uses annual observations from the U.S. Energy Information Administration’s Electric Power Operational Data with fueltypeid=NGO, sectorid=99 (All Sectors), the heat-content field, and a common 2025 period across the 50 states and the District of Columbia.
This measure should not be read as fuel consumption, electricity generation, or efficiency. Average heat content describes the amount of energy associated with a unit of fuel volume. A state can have a relatively high MMBtu-per-Mcf value while using little gas, and another can consume a very large volume even with a slightly lower heat-content factor. The metric is best treated as a conversion characteristic of the reported fuel mix rather than a scale indicator for the power system.
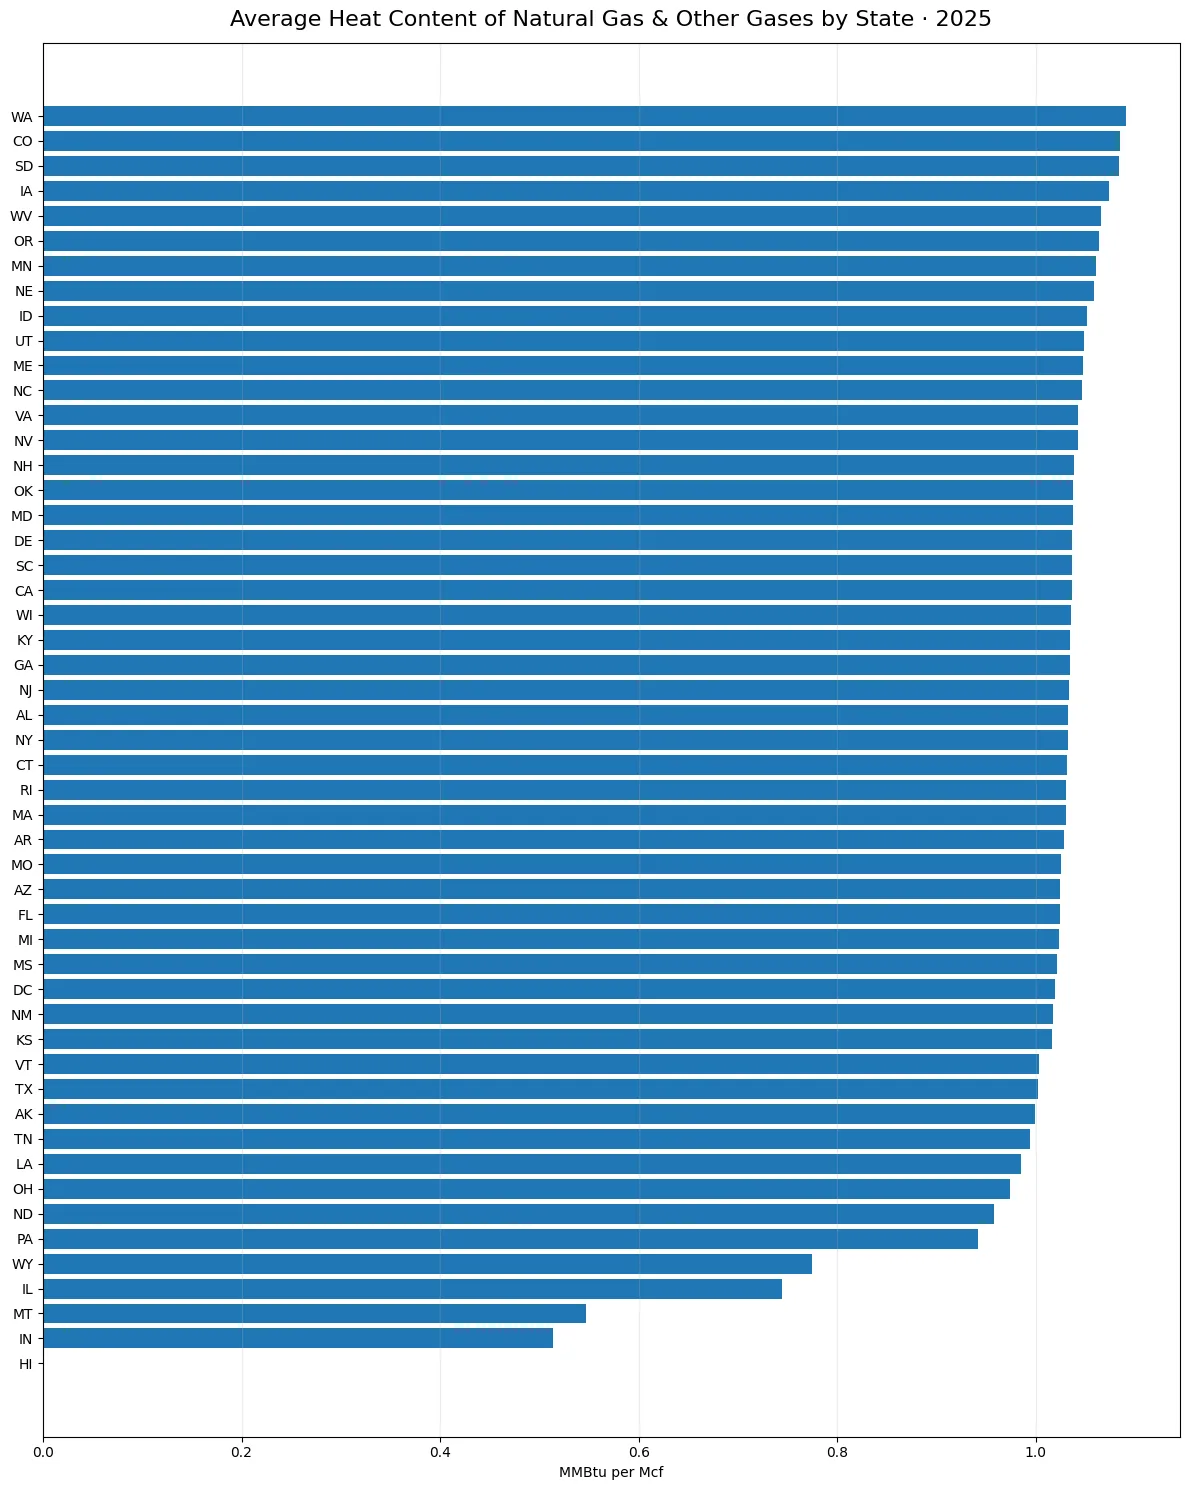
Table of Contents
Washington, Colorado and South Dakota formed the top cluster
The first ten positions were Washington 1.0906, Colorado 1.0847, South Dakota 1.0841, Iowa 1.0734, West Virginia 1.0655, Oregon 1.0637, Minnesota 1.0609, Nebraska 1.0586, Idaho 1.0519 and Utah 1.0487 MMBtu per Mcf. Those figures are relatively close together compared with the large ranges seen in quantity-based energy statistics. The ranking therefore says more about small differences in average fuel properties than about the size of each state’s energy market.
| State | Code | Average heat content (MMBtu/Mcf) |
|---|---|---|
| Washington | WA | 1.0906 |
| Colorado | CO | 1.0847 |
| South Dakota | SD | 1.0841 |
| Iowa | IA | 1.0734 |
| West Virginia | WV | 1.0655 |
| Oregon | OR | 1.0637 |
| Minnesota | MN | 1.0609 |
| Nebraska | NE | 1.0586 |
| Idaho | ID | 1.0519 |
| Utah | UT | 1.0487 |
Washington exceeded Colorado by only 0.0059 MMBtu per Mcf, and Colorado exceeded South Dakota by 0.0006. That makes the top three better understood as a high-value group than as sharply separated tiers. The observations do not identify the precise fuel blend, supply origin, facility mix or operational reason behind each state average, so the numerical order should not be converted into a claim about gas quality or plant performance.
Most positive observations were centered close to 1.0 MMBtu per Mcf
Excluding the reported zero for Hawaii, the 50 positive observations had an unweighted mean of 1.0002 MMBtu per Mcf and a median of 1.0322. The first quartile was 1.0166 and the third quartile 1.0423. This relatively compact middle range shows that most state values were clustered around the same general energy-per-volume scale even though a handful of states sat well below or above it.
Among the positive values, 9 states were at or above 1.05 MMBtu per Mcf, 31 were between 1.00 and 1.05, and 10 were below 1.00. Because the spread around the center is modest for many states, retaining four decimal places helps preserve meaningful differences. Rounding everything to one decimal place would erase most of the state variation and make many observations appear identical.
Hawaii’s 0.0000 is a reported value, not a missing cell
The state slice contains a numeric observation for every jurisdiction, so there are no null values to impute. Hawaii, however, is reported as 0.0000. A literal interpretation that the fuel itself contained no energy would be physically inappropriate for an average heat-content measure. The zero should instead be treated as the value returned for this particular EIA fuel-and-sector combination, potentially reflecting the absence of applicable reported consumption or another feature of the aggregation.
For that reason, the zero is preserved in tables and coverage counts rather than silently replaced. At the same time, summary statistics for the typical heat-content level are more informative when the positive observations are described separately. This approach keeps the published record intact while avoiding the misleading conclusion that Hawaii’s natural gas had zero calorific value. Determining the exact reason would require a more detailed facility- or fuel-level investigation.
Indiana and Montana were the lowest positive observations
After the Hawaii zero, Indiana had the lowest positive value at 0.5133 MMBtu per Mcf and Montana followed at 0.5471. Illinois was 0.7442, Wyoming 0.7746 and Pennsylvania 0.9415. Indiana and Montana stand notably below the large cluster around 1.0, making them the most pronounced positive-value outliers in the 2025 state distribution.
| State | Code | Reported value (MMBtu/Mcf) |
|---|---|---|
| Hawaii | HI | 0.0000 |
| Indiana | IN | 0.5133 |
| Montana | MT | 0.5471 |
| Illinois | IL | 0.7442 |
| Wyoming | WY | 0.7746 |
| Pennsylvania | PA | 0.9415 |
| North Dakota | ND | 0.9582 |
| Ohio | OH | 0.9744 |
| Louisiana | LA | 0.9851 |
| Tennessee | TN | 0.9936 |
Across positive observations, the distance from Washington’s 1.0906 to Indiana’s 0.5133 was 0.5773 MMBtu per Mcf. That gap is large enough to merit attention, but the heat-content field alone does not reveal its cause. Explanations involving composition, fuel sourcing, other-gas shares or the mix of reporting plants should be tested with data that actually contain those dimensions rather than inferred from this ranking.
The NGO fuel category is broader than a simple natural-gas label
The EIA selection uses fueltypeid=NGO and is described as Natural Gas & Other Gases. That matters when comparing the values with other EIA natural-gas series. A table devoted strictly to delivered natural gas may use a different fuel definition, coverage or reporting framework. Numerical differences across those sources are not necessarily contradictions; they can arise because the underlying categories and populations differ.
Sectorid=99 also needs a narrow interpretation. “All Sectors” refers to the aggregation used inside the Electric Power Operational Data route. It should not be expanded into a statement about every use of natural gas across the entire U.S. economy. Residential heating, commercial deliveries, pipeline use and other natural-gas statistics can be published in separate EIA systems with different definitions. This article stays within the electric-power operational scope.
MMBtu per Mcf functions as an energy-per-volume conversion factor
Mcf denotes one thousand cubic feet of gas, while MMBtu denotes one million British thermal units. An average of roughly 1.03 MMBtu per Mcf is therefore consistent with natural gas containing roughly a thousand Btu per cubic foot. EIA’s public natural-gas heat-content tables commonly show values near that magnitude when expressed as Btu per cubic foot. Keeping the state series in MMBtu per Mcf preserves the 1.x scale used by the underlying operational observations.
The conversion factor can be combined with a compatible volume series to estimate energy input, but it cannot provide total consumption by itself. For example, a state at 1.08 MMBtu per Mcf may still have less total gas energy use than a state at 1.02 if its consumed volume is much smaller. The same distinction applies to generation efficiency: an efficiency measure requires both energy input and useful output, not heat content alone.
A one-year state ranking is not a permanent fuel characteristic
Every observation refers to 2025, which gives the comparison a consistent time basis. It does not mean the ordering will remain unchanged. Average heat content can move when supply patterns change, when the mix of facilities operating in a state changes, or when the relative amount of different reported gases shifts. A trend study should keep the NGO fuel code, sector 99 and heat-content field fixed while comparing multiple years.
Recent EIA electricity data can also be revised as annual reporting matures. The 2025 ranking is therefore best viewed as the current annual snapshot for this route, not a timeless classification of states. Policy or investment conclusions would require a broader set of variables and repeated observations, especially if a state appears unusual because of one annual value.
How to read the source and coverage correctly
The source is the U.S. Energy Information Administration Electric Power Operational Data API. The selection fixes annual 2025, fueltypeid=NGO, sectorid=99 and the heat-content field. It returns 51 state-level jurisdictions: all 50 states plus the District of Columbia. All 51 rows contain numeric values; one of those values is the reported zero for Hawaii.
The most useful conclusions are descriptive. Washington, Colorado and South Dakota occupied the upper end; many states clustered near 1.0 MMBtu per Mcf; Indiana and Montana were unusually low among positive values; and Hawaii was returned as zero under this specific series. None of those facts establishes total consumption, fuel costs, generation volume, emissions or plant efficiency. Those questions require separate EIA measures with their own units and denominators.
Frequently Asked Questions
Which state had the highest 2025 average heat-content value?
Washington was highest at 1.0906 MMBtu per Mcf, followed by Colorado at 1.0847 and South Dakota at 1.0841.
Does a higher MMBtu-per-Mcf value mean a state consumed more gas?
No. The measure describes average energy per unit of gas volume, not total fuel consumption or electricity generation.
Is Hawaii’s 0.0000 a missing value?
No. It is returned as a numeric zero in this series. It is preserved, but it should not be interpreted as literal zero physical heat content without additional context.
Does sector 99 All Sectors cover every use of natural gas in the U.S. economy?
No. It is the all-sector aggregation within EIA Electric Power Operational Data, not a measure of all end-use natural-gas consumption.
Related Articles
Green Map creates custom-edited map images using open geographic data sources such as geoBoundaries, Natural Earth, OpenStreetMap, and government open data. These maps are edited visual materials, not raw data files, and are provided for education, documents, presentations, and graphic reference.