Florida had the largest 2025 value in the U.S. Energy Information Administration series for fuel consumed by Electric Utilities to generate electricity. The state recorded 1,884.76905 million MMBtu. Georgia followed at 1,101.48170, and North Carolina at 1,023.91016 million MMBtu. Across the 50 states and the District of Columbia, the 51 published observations sum to 19,378.61039 million MMBtu. These figures describe energy input to electricity generation, not electricity output. That distinction matters because a fuel-consumption ranking can differ materially from a net-generation ranking.
The query identity is fueltypeid=ALL, sectorid=1, field=consumption-for-eg-btu, annual frequency, and 2025. The ALL fuel facet combines the eligible fuels in this series rather than isolating natural gas, coal, petroleum, renewables, or another category. Sector 1 is Electric Utility. It should not be treated as interchangeable with the broader Electric Power sector or with Independent Power Producers. Keeping this identity intact is the simplest way to avoid comparing two legitimate but different EIA slices as if they were the same dataset.
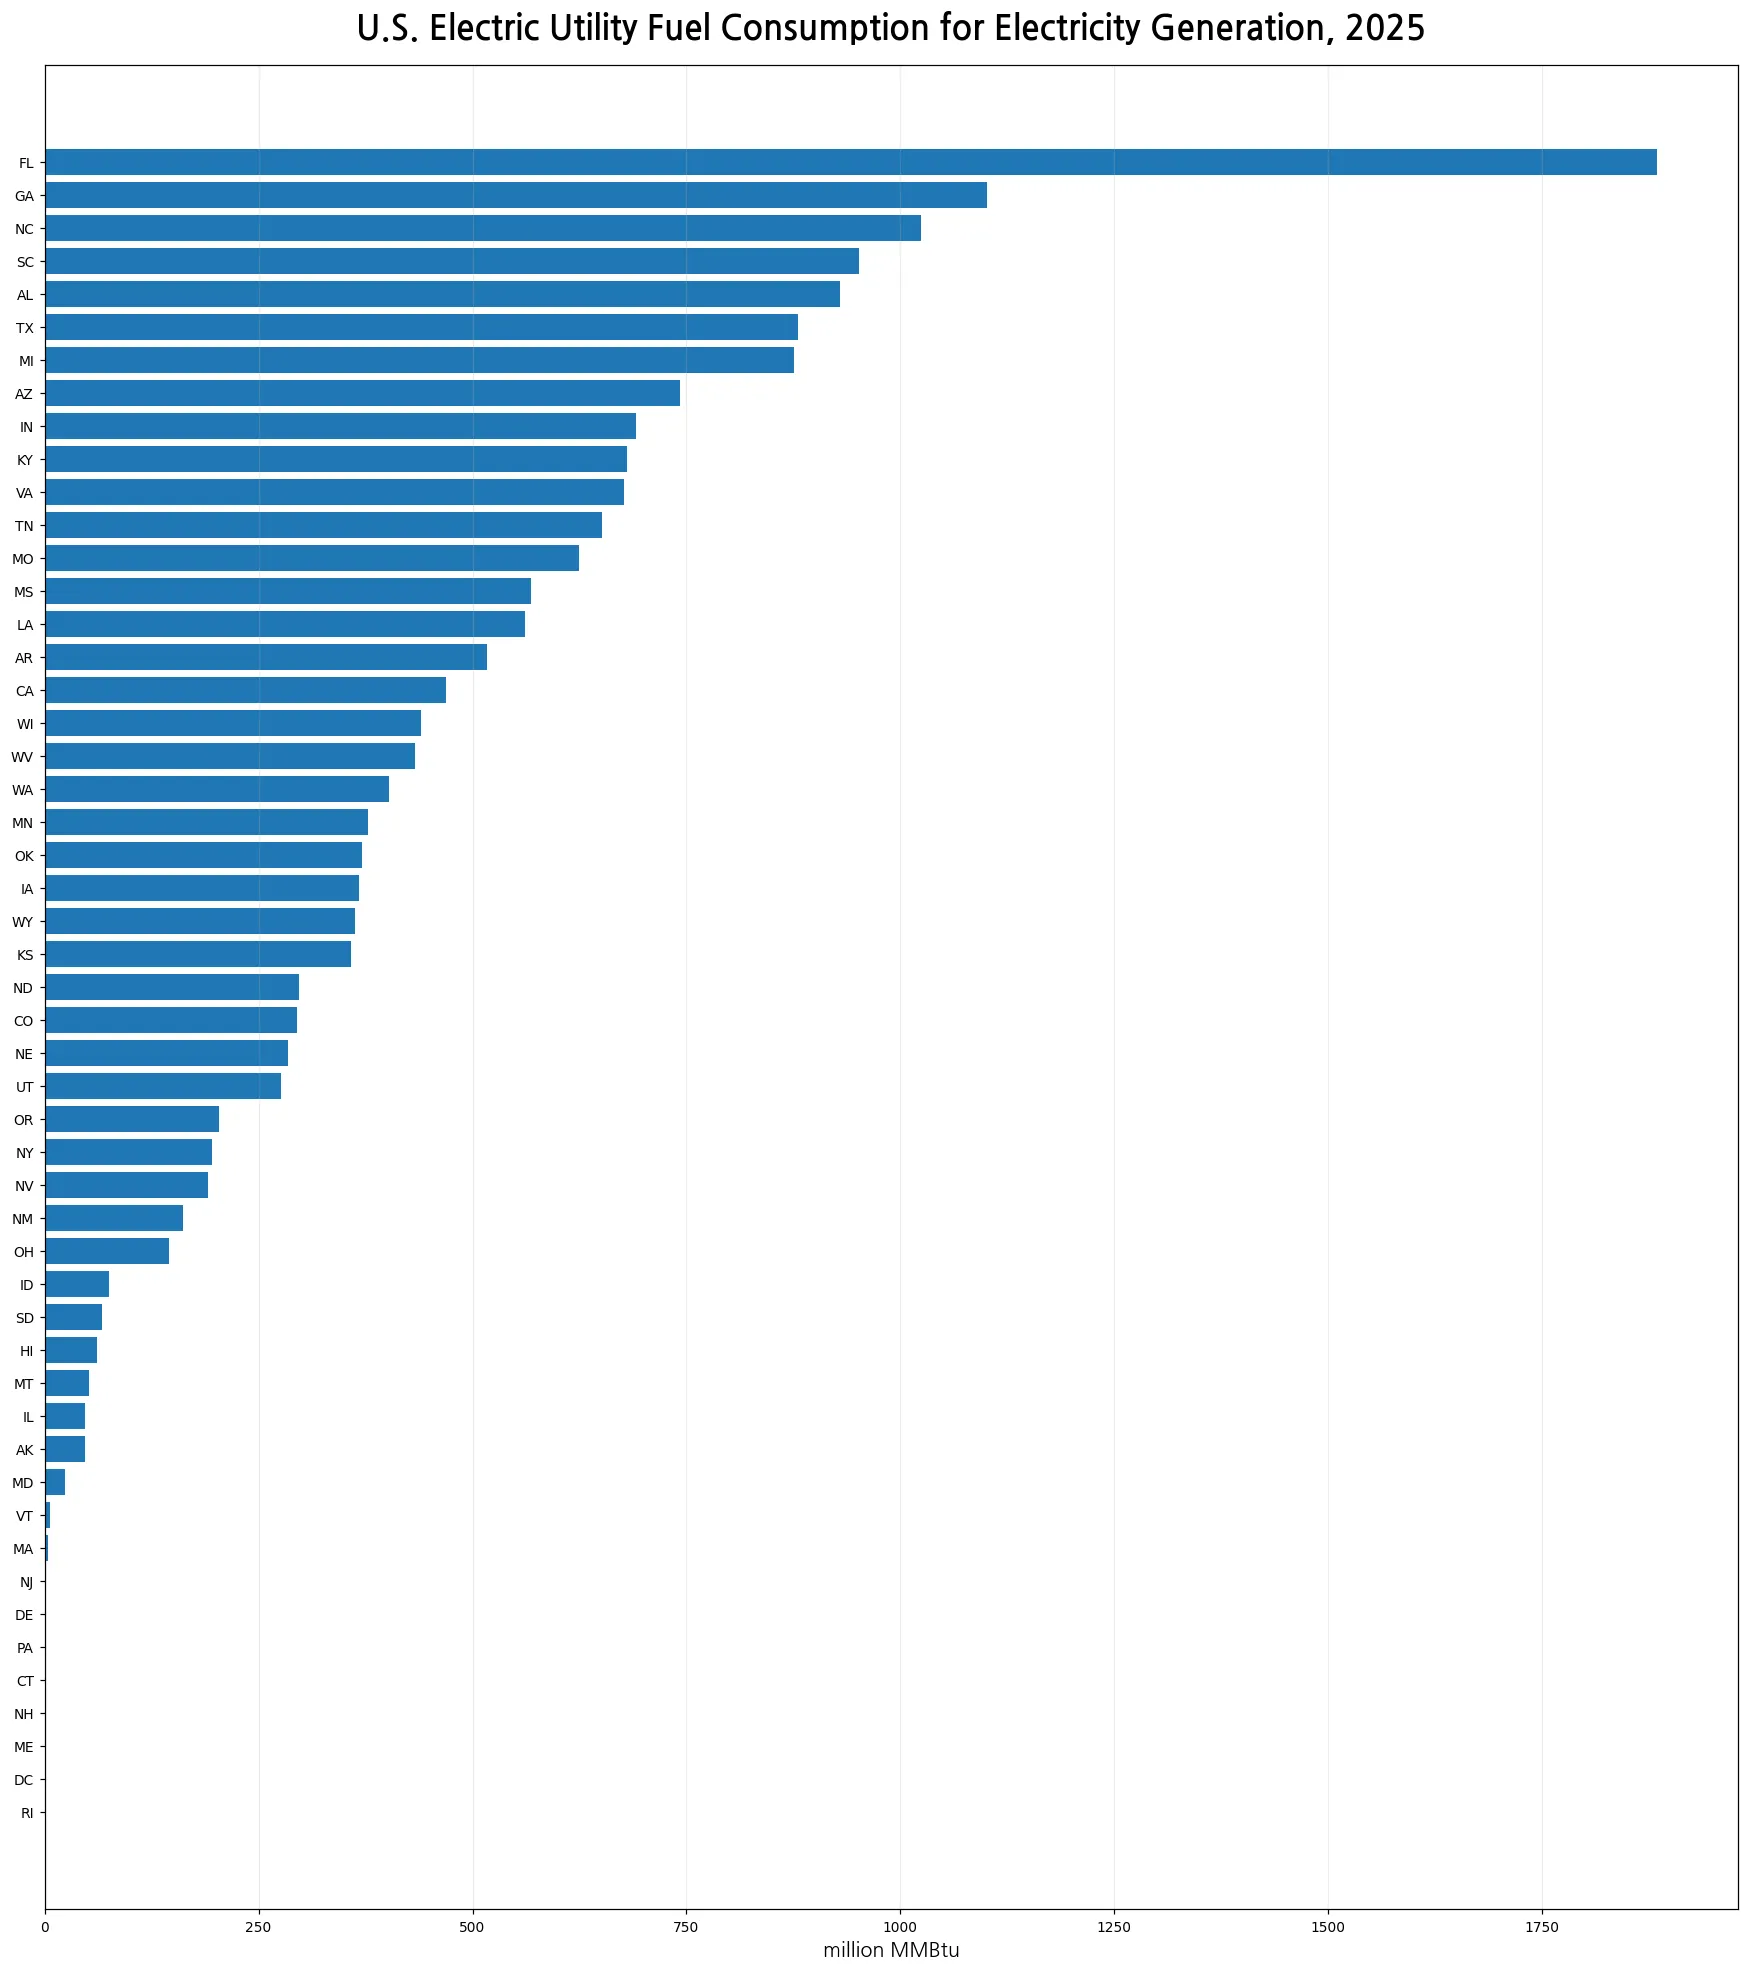
Table of Contents
Florida led, but the national pattern was relatively distributed
Florida contributed 9.73% of the sum of the 51 state-level observations. Its value was about 1.71 times Georgia’s. The top five states together account for 30.41% of the total, and the top ten for 50.38%. That means nearly half of the state-level sum remains outside the ten largest observations. The distribution is therefore concentrated enough for the leading states to matter, but not so concentrated that one or two jurisdictions define the entire picture. Looking beyond the first rank is essential for understanding this metric.
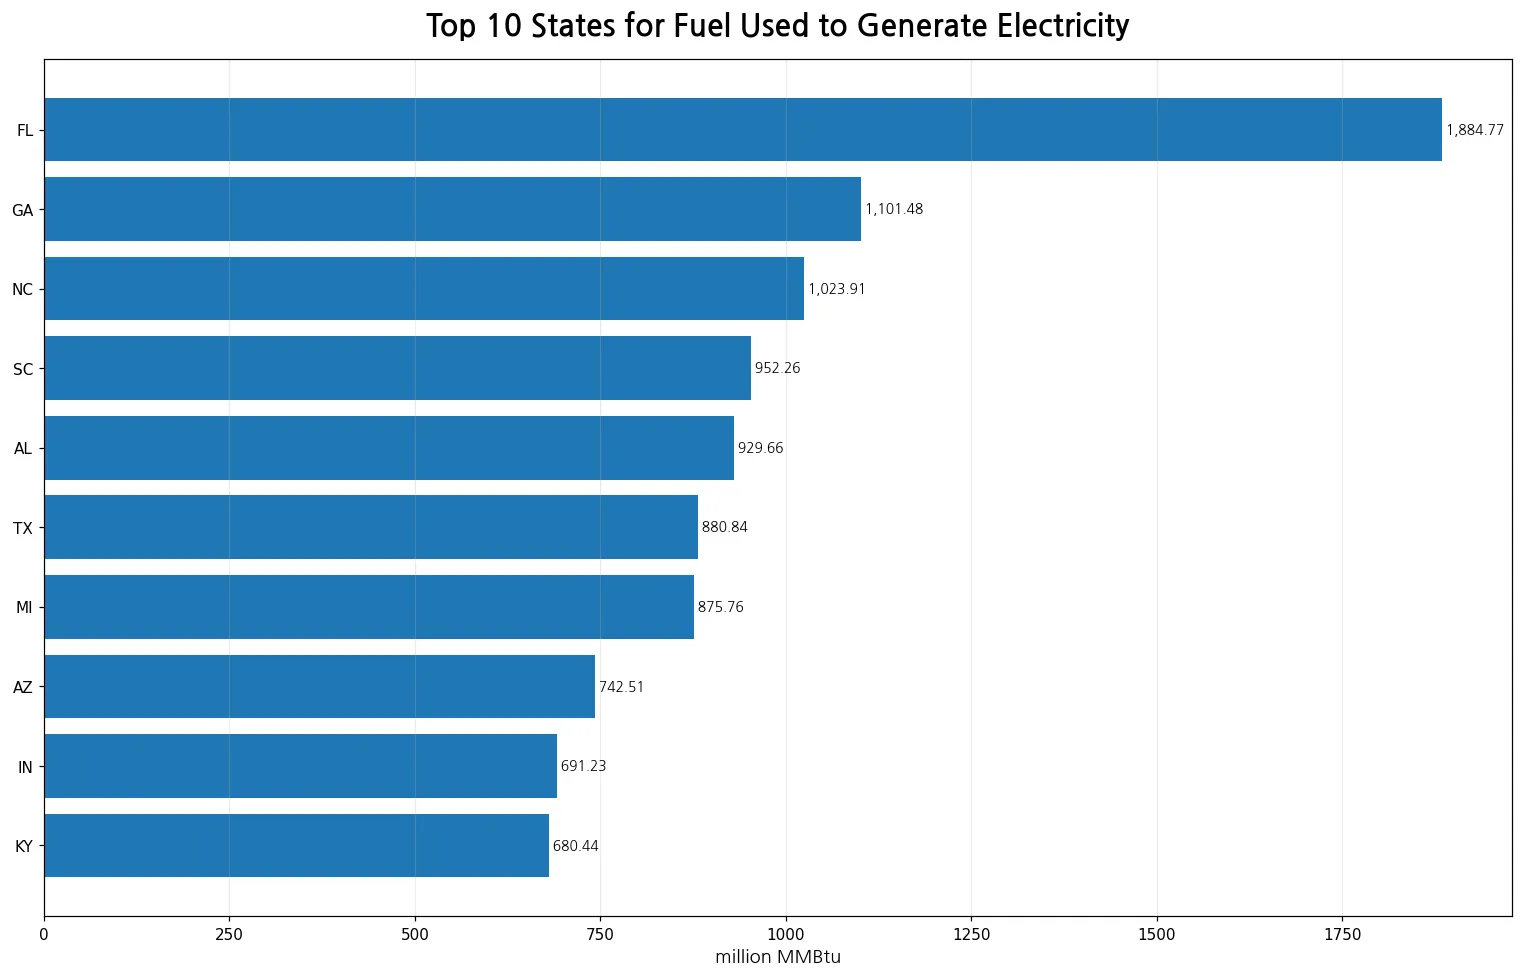
A cluster of southeastern states appears near the top
Florida, Georgia, North Carolina, South Carolina, and Alabama all appear in the top five. That geographic clustering is more informative than a single isolated maximum because it suggests the high values are not confined to one unusual state. Still, the annual all-fuels series cannot identify the cause of the pattern. Different generation fleets, load levels, fuel mixes, plant efficiencies, operating schedules, and ownership structures can all matter. A causal explanation would require matching this series with additional EIA fields rather than inferring a story from the ranking alone.
| State | million MMBtu | Share of 51-observation sum |
|---|---|---|
| Florida | 1,884.76905 | 9.73% |
| Georgia | 1,101.48170 | 5.68% |
| North Carolina | 1,023.91016 | 5.28% |
| South Carolina | 952.25861 | 4.91% |
| Alabama | 929.66451 | 4.80% |
| Texas | 880.83890 | 4.55% |
| Michigan | 875.76024 | 4.52% |
| Arizona | 742.50976 | 3.83% |
| Indiana | 691.23237 | 3.57% |
| Kentucky | 680.43904 | 3.51% |
The mean is higher than the median because the upper tail is substantial
The mean state-level value is 379.97275 million MMBtu, while the median is 297.06908. The mean is about 1.28 times the median, showing that the larger observations pull the average upward. Florida is the largest value, but there is also a broad upper tier: Georgia, North Carolina, South Carolina, Alabama, Texas, and Michigan all remain well above the median. For readers trying to understand a typical state, the median is therefore more informative than the mean alone, while the mean remains useful for describing the aggregate scale of the distribution.
All 51 jurisdictions have published values
There are 0 missing values and 0 exact zeros in the 2025 file. The smallest observation is Rhode Island at 0.00030 million MMBtu. Because every jurisdiction has a numerical value, no missing record was converted to zero or filled through interpolation. This is an important quality distinction. A very small reported value still represents an observation, whereas a missing value could indicate nonreporting, suppression, or unavailable data. The full-state chart retains the original scale so the low end of the distribution remains visible.
Fuel input and electricity output answer different questions
The consumption-for-eg-btu field measures the energy content of fuel used for electricity generation. Net generation, in contrast, measures the electricity produced and is typically expressed in megawatthours. The relationship between those two quantities depends on technology and operating efficiency. A state can consume a large amount of fuel yet not occupy the same rank in net generation, and a state with a generation mix that includes noncombustible renewables can look very different across the two measures. For that reason, this dataset should not be used as an efficiency score or as a direct substitute for generation statistics.
Sector 1 keeps the analysis focused on Electric Utilities
The sector boundary is one of the most important details in the dataset. Sector 1 refers to Electric Utility, while other EIA operational-data slices can represent Independent Power Producers, the full Electric Power sector, or more specialized combined-heat-and-power categories. Even when the year, fuel facet, field, and unit look similar, changing the sector can produce a different state ranking. Any year-over-year extension of this article should therefore hold fueltypeid, sectorid, field, unit, and frequency constant before comparing the values.
What the 2025 values support—and what they do not
The data directly support statements about which states had larger or smaller fuel-energy inputs for Electric Utility electricity generation, how concentrated the upper end was, and how the 51 observations were distributed. They do not directly measure retail electricity prices, carbon emissions, plant efficiency, renewable shares, or the cost of the fuel consumed. A high value is not evidence that a state is inefficient, and a low value is not evidence that it is cleaner. Those questions require generation, fuel-specific, emissions, capacity, or cost data that are outside this single series.
Why the top-10 and full-state views are both useful
The top-ten chart makes the leading values easy to compare, especially the gap between Florida and Georgia and the close grouping among several states below them. The full 51-jurisdiction chart provides different information: it shows the long middle of the distribution and the very small values that disappear visually when only leaders are shown. The median of 297.06908 million MMBtu sits well below the top group, reinforcing the idea that a typical jurisdiction is much smaller than the leaders. Using both views avoids overstating the importance of either the top ranks or the lower tail.
Source and calculation method
The source is the U.S. Energy Information Administration electricity/electric-power-operational-data annual series. The fixed query uses 2025, fueltypeid=ALL, sectorid=1, and consumption-for-eg-btu. The sum (19,378.61039), mean (379.97275), median (297.06908), and state shares were calculated directly from the 51 published observations. No values were estimated, zero-filled, or combined across years. Percentages in this article use the sum of the same 51 observations as the denominator, so they describe each state’s share of this specific series rather than its share of every form of U.S. energy use.
Frequently Asked Questions
Which state used the most fuel energy for Electric Utility electricity generation in 2025?
Florida ranked first at 1,884.76905 million MMBtu, or about 9.73% of the sum of the 51 published state-level observations.
Is this the same as net electricity generation?
No. consumption-for-eg-btu measures the energy content of fuel used to generate electricity, while net generation measures electricity output.
Does sectorid=1 represent the entire Electric Power sector?
No. Sector 1 is Electric Utility and should be kept separate from broader or differently defined EIA sectors.
Were missing values filled with zero?
No. All 51 jurisdictions have published numerical values; there are 0 missing observations and 0 exact zeros.
Related Articles
Green Map creates custom-edited map images using open geographic data sources such as geoBoundaries, Natural Earth, OpenStreetMap, and government open data. These maps are edited visual materials, not raw data files, and are provided for education, documents, presentations, and graphic reference.