Texas recorded the largest 2025 value in the U.S. Energy Information Administration Electric Power series for net generation, at 546,478.820 thousand MWh. Florida followed with 263,242.376 thousand MWh, and Pennsylvania ranked third at 242,298.448 thousand MWh. The verified state file contains 51 annual observations covering all 50 states and the District of Columbia. Their sum is 4,275,201.550 thousand MWh, or about 4,275.2 TWh.
The scope of the series matters as much as the ranking. The EIA facets are sectorid=98, labeled Electric Power, and fueltypeid=ALL. That makes this broader than a sector-specific slice such as Electric Utility or Independent Power Producers, while still remaining a defined EIA operational-data series. Because the fuel facet is ALL, the values combine eligible generation from all fuels within this sector rather than showing any single fuel source.
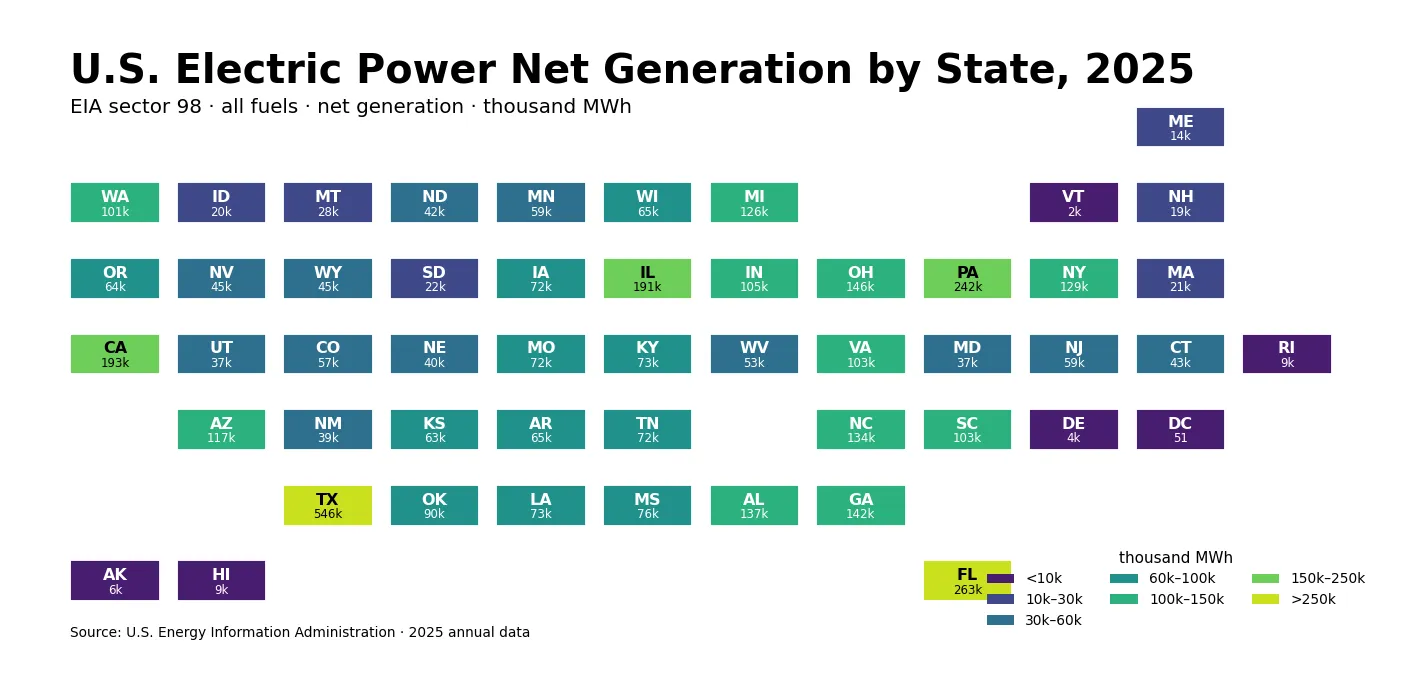
Table of Contents
Texas accounted for 12.78% of the 51-jurisdiction sum
Texas represented 12.78% of the summed state observations. Its value exceeded Florida by 283,236.443 thousand MWh and was about 2.08 times Florida’s total. That lead is substantial, but it does not mean U.S. Electric Power net generation was concentrated in a single state: the other 50 jurisdictions together accounted for 87.22% of the same denominator.
The top three states—Texas, Florida, and Pennsylvania—made up 24.61% of the 51-state sum. Adding California and Illinois increased the top-five share to 33.58%. The upper tier therefore spans multiple regions, including the South, Northeast, West, and Midwest. The distribution is not simply a regional cluster, even though several large southern states appear near the top.
The top 10 states contributed almost half of the total
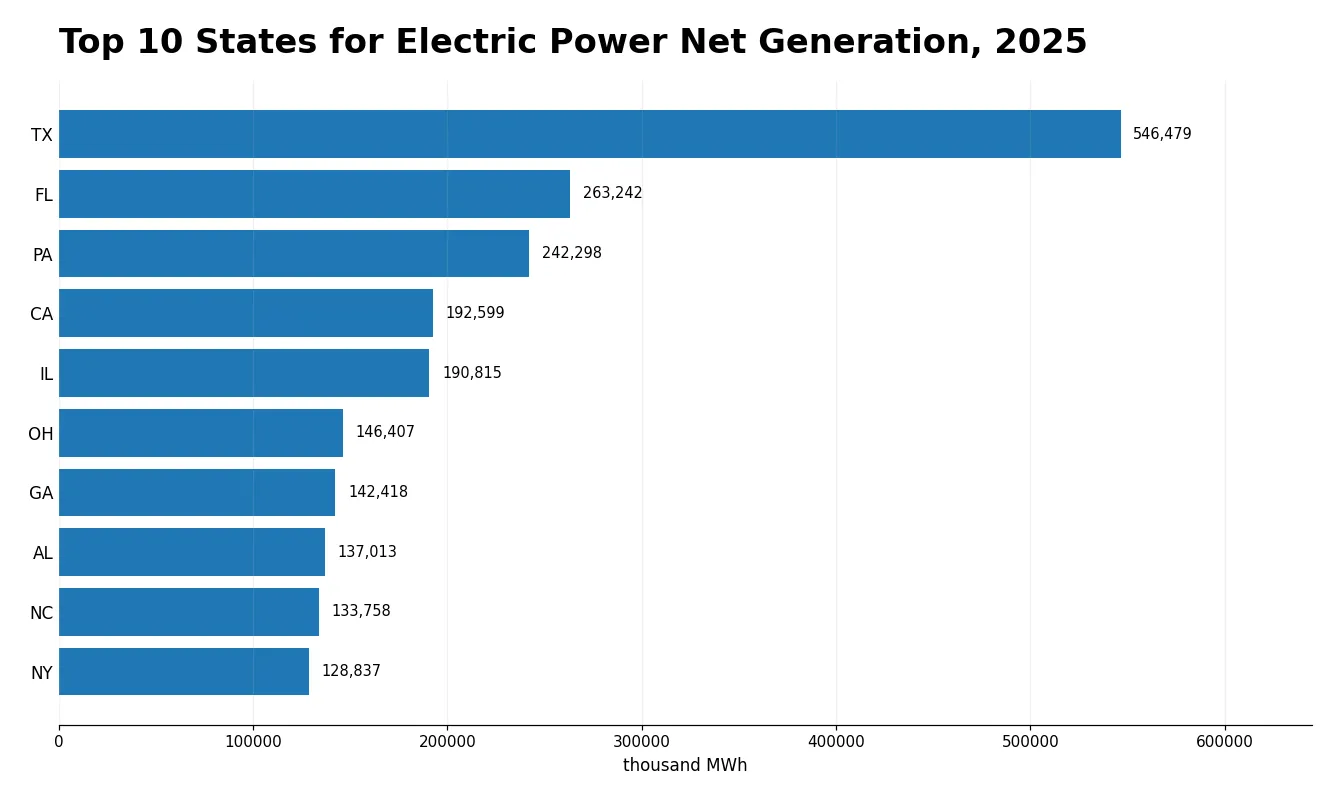
The ten largest state observations accounted for 49.68% of the 51-jurisdiction sum. Extending the cutoff to the top 15 raised the cumulative share to 62.62%. This is an important complement to the rank order. Texas is far ahead of second place, but roughly half of the measured state total still comes from jurisdictions outside the top ten.
| Rank | State | Net generation (thousand MWh) | Share of 51-jurisdiction sum |
|---|---|---|---|
| 1 | Texas | 546,478.820 | 12.78% |
| 2 | Florida | 263,242.376 | 6.16% |
| 3 | Pennsylvania | 242,298.448 | 5.67% |
| 4 | California | 192,599.064 | 4.51% |
| 5 | Illinois | 190,815.104 | 4.46% |
| 6 | Ohio | 146,407.214 | 3.42% |
| 7 | Georgia | 142,417.766 | 3.33% |
| 8 | Alabama | 137,012.760 | 3.20% |
| 9 | North Carolina | 133,757.767 | 3.13% |
| 10 | New York | 128,837.247 | 3.01% |
The top ten are Texas, Florida, Pennsylvania, California, Illinois, Ohio, Georgia, Alabama, North Carolina, and New York. Those states do not share one generation mix. Since the series uses fueltypeid=ALL, the state totals can combine natural gas, coal, nuclear, hydroelectric, wind, solar, and other eligible sources. Similar totals can therefore arise from very different power systems.
The mean was well above the median
The arithmetic mean across the 51 observations was 83,827.481 thousand MWh, while the median was 63,831.460 thousand MWh. The mean was about 1.31 times the median. The first quartile was 37,106.102 thousand MWh and the third quartile was 103,891.689 thousand MWh, so the middle half of the distribution fell roughly between 37,106 and 103,892 thousand MWh.
That gap between the mean and median reflects the influence of unusually large values at the upper end, especially Texas. For a skewed state distribution, the median and quartiles often provide a more useful description of a typical observation than the mean alone. Cumulative shares add another perspective by showing how quickly the largest states account for the national state-level total.
Small values at the bottom are published observations, not filled-in missing data
The District of Columbia had the smallest value at 50.816 thousand MWh. Vermont reported 2,255.694, Delaware 4,177.628, Alaska 5,939.646, and Hawaii 8,831.238 thousand MWh. All 51 rows contain numeric observations. No missing state was converted to zero, and no value was imputed from another year.
A low generation value does not by itself explain the structure of a state electricity system. State size, plant ownership, resource mix, imports and exports, and transmission patterns can all matter, but those explanatory variables are not part of this file. The correct descriptive conclusion is simply that the published sector 98 net-generation observation was smaller for those jurisdictions in 2025.
Net generation is different from capacity, fuel use, and electricity consumption
The EIA generation field measures an electricity output quantity. It should not be substituted for installed capacity, which describes the ability to produce power, or for fuel consumption, which measures inputs to generation. A state can rank differently on all three metrics. Net generation also differs from gross generation because power plants use some electricity internally before the net quantity is available to the grid.
Generation is not the same as end-use electricity consumption within a state. Electricity can move across state lines, so the place where electricity is produced can differ from the place where it is consumed. Texas leading this series therefore does not establish that Texas had the highest electricity consumption, and a low generation value does not establish low demand.
The all-fuels total is useful for scale but hides the generation mix
Using fueltypeid=ALL answers a broad question: how much net generation was recorded in the Electric Power sector in each state regardless of fuel? That makes it useful for comparing overall generation scale. The tradeoff is that the total does not reveal how much came from natural gas, coal, nuclear power, hydroelectricity, wind, solar, or other sources.
A fuel-specific analysis would need separate EIA observations with the same year, geography, sector, frequency, and generation field but a different fuel facet. Those values could then be compared with the all-fuels total when the definitions align. The all-fuels figure alone cannot support claims about a state’s renewable share, fossil-fuel dependence, emissions profile, or energy-transition pace.
Converting thousand MWh to TWh makes the scale easier to read
The reported unit is thousand megawatthours. Texas’s 546,478.820 thousand MWh is approximately 546.479 TWh, while the sum of all 51 state observations is about 4,275.202 TWh. The conversion changes only the display unit, not the metric scope. The series remains 2025 net generation for sector 98 with all fuels combined.
The percentages in the table use the sum of these 51 observations as the denominator. Texas’s 12.78% is therefore a share of the state-level sector 98 total used in this analysis. It should not automatically be described as 12.78% of every possible U.S. electricity aggregate, because a differently defined national series could use a different scope or accounting treatment.
What the 2025 distribution shows—and what it does not
Three descriptive features stand out: Texas is a clear first-place observation, the top ten states contribute about half of the total, and the median is well below the mean. Together, those facts indicate a distribution with a heavy upper tail but also a broad base of substantial generation across many states. Because there are no missing rows, the ranking is not being driven by imputation choices.
The dataset does not identify the causes of those differences. It does not include plant-level capacity, fuel prices, capacity factors, wholesale transfers, hourly demand, outage schedules, or weather. Any causal explanation would need additional evidence. The safest use of this series is to compare state-scale output under a fixed EIA definition and then add other datasets only when the analytical question requires them.
Why sector 98 should stay visible in comparisons
EIA operational-data series can look similar while changing only one facet. A page about Electric Utility generation, Independent Power Producer generation, renewable fuel use, or non-CHP fuel consumption may share the same geography and year but measure a different slice of the power system. Sector 98 is part of the metric identity here, not a technical footnote.
Keeping the sector label visible prevents false duplicate matches and misleading cross-page comparisons. For example, a state may rank very differently in a narrow ownership sector than it does in the broader Electric Power total. When comparing two EIA pages, the field, sectorid, fueltypeid, unit, frequency, geography, and year should all be checked before drawing conclusions from differences in rank or magnitude.
Source and calculation method
The source is the U.S. Energy Information Administration electricity/electric-power-operational-data API. The annual query uses the generation field for 2025 with fueltypeid=ALL and sectorid=98 at state geography. The file contains 51 rows: one for each state and the District of Columbia. Rankings, sums, means, medians, quartiles, and cumulative shares were calculated directly from those published values.
The state tile visualization uses a fixed grid of state abbreviations to make broad differences easy to scan. It is not a boundary-accurate choropleth and should not be used to infer area or distance. Quantitative comparisons should rely on the table and EIA values; the visualization is a compact aid for reading the distribution.
Frequently Asked Questions
Which state had the most Electric Power net generation in 2025?
Texas ranked first at 546,478.820 thousand MWh, equal to 12.78% of the sum of the 51 state-level observations.
Is sector 98 the same as the Electric Utility sector?
No. This dataset is the EIA Electric Power sector 98 series and should be kept separate from narrower sector-specific series such as Electric Utility.
Does high net generation mean a state also consumed the most electricity?
No. Generation and end-use consumption are different measures, and electricity can be transmitted across state lines.
What does fueltypeid=ALL mean?
It combines the eligible fuels in this sector into one all-fuels net-generation value rather than isolating a single fuel.
Related Articles
Green Map creates custom-edited map images using open geographic data sources such as geoBoundaries, Natural Earth, OpenStreetMap, and government open data. These maps are edited visual materials, not raw data files, and are provided for education, documents, presentations, and graphic reference.