Buchanan County sits in northeastern Iowa, with Independence serving as the clearest reference point for the county’s road network and settlement pattern. US 20 crosses the county from west to east, Iowa 150 runs north and south through Independence, and the Wapsipinicon River system occupies the lower western side of the terrain. Farther east, Buffalo Creek and its branches cut through higher ground that becomes especially clear on the elevation map. The maps on this page can be viewed directly in the article, and the original high-resolution JPG versions are also available together in a downloadable ZIP file.
The set is most useful when the maps are read together rather than as four versions of the same picture. The county map establishes roads, towns, boundaries, and major streams. The city map compares six mapped communities and their relative positions. The terrain-and-water map brings the Wapsipinicon River, Little Wapsipinicon River, Buffalo Creek, and smaller tributaries into focus, while the elevation map shows why western river valleys look different from the higher northeast and east. These distinctions make it easier to understand Buchanan County before using a more detailed road, parcel, flood, or survey map for a specialized purpose.
Table of Contents
Independence anchors the county road map at US 20 and Iowa 150
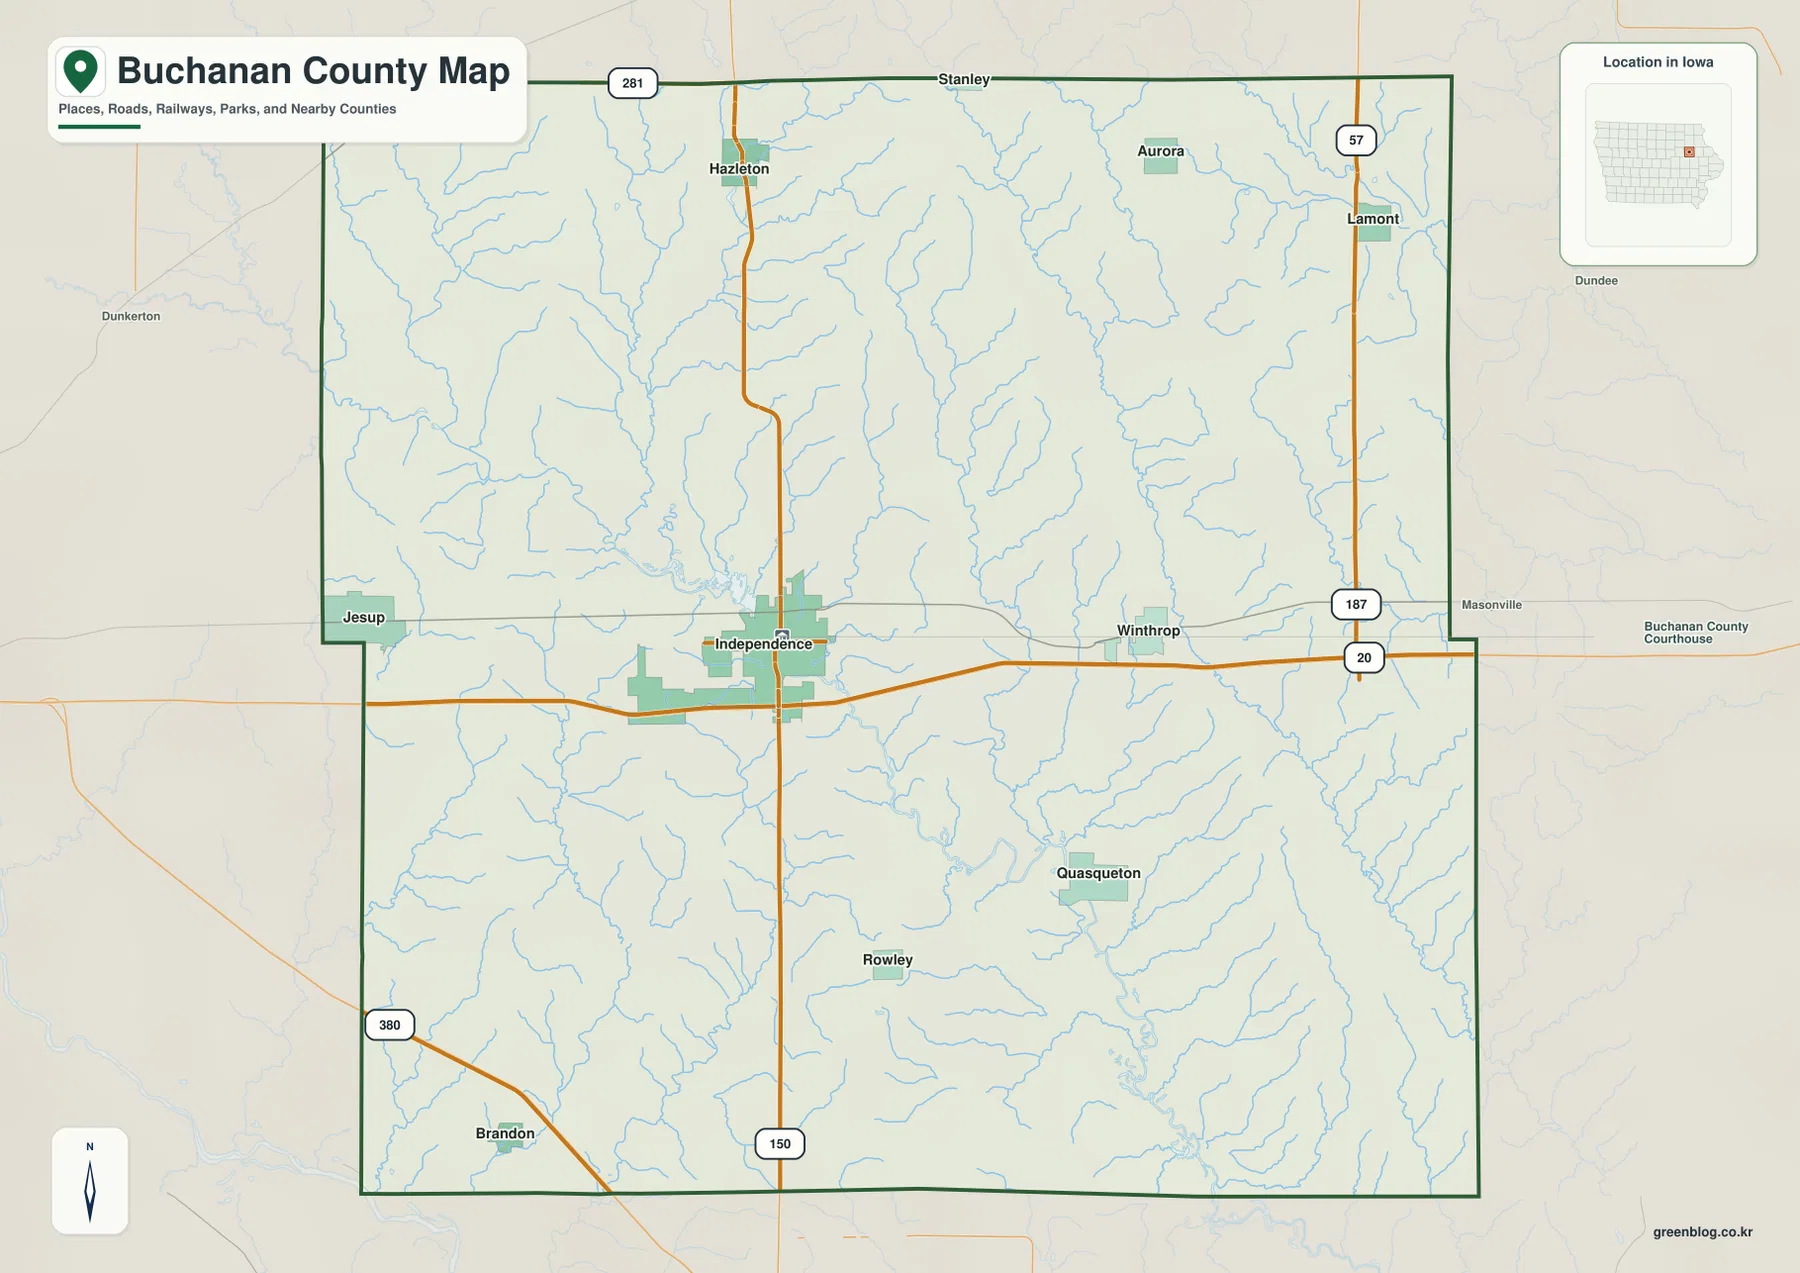
Independence appears slightly west of the county’s center and is the easiest place to begin reading the general map. US 20 runs through the city on a west-to-east line and continues toward Winthrop, while Iowa 150 comes down from the Hazleton area, passes Independence, and continues south. Once those two highways are located, the rest of the map becomes easier to organize. Winthrop lies east along US 20, Hazleton is north on Iowa 150, and Quasqueton is southeast of Independence among a denser pattern of streams and smaller roads.
Jesup is shown close to the western boundary, Fairbank is near the northwest corner, and Aurora and Lamont appear in the northern and northeastern part of the map. Rowley sits south of Independence, while Brandon is near the southwest. These places are separated by broad rural areas rather than forming one continuous built-up corridor. Reading the town labels together with the highways gives a much clearer sense of location than memorizing names by themselves.
The county map is intended as an overview, not as a street-by-street navigation sheet. It emphasizes the main towns, through roads, county outline, and a visible stream network. For a quick orientation, start at Independence, follow US 20 toward Winthrop, then use Iowa 150 to compare the northern Hazleton area with the southern part of the county. Iowa 187 and Iowa 57 help identify the eastern side, while I-380 is a useful reference in the southwest.
The six-city index shows a strong Independence center and widely spaced smaller towns
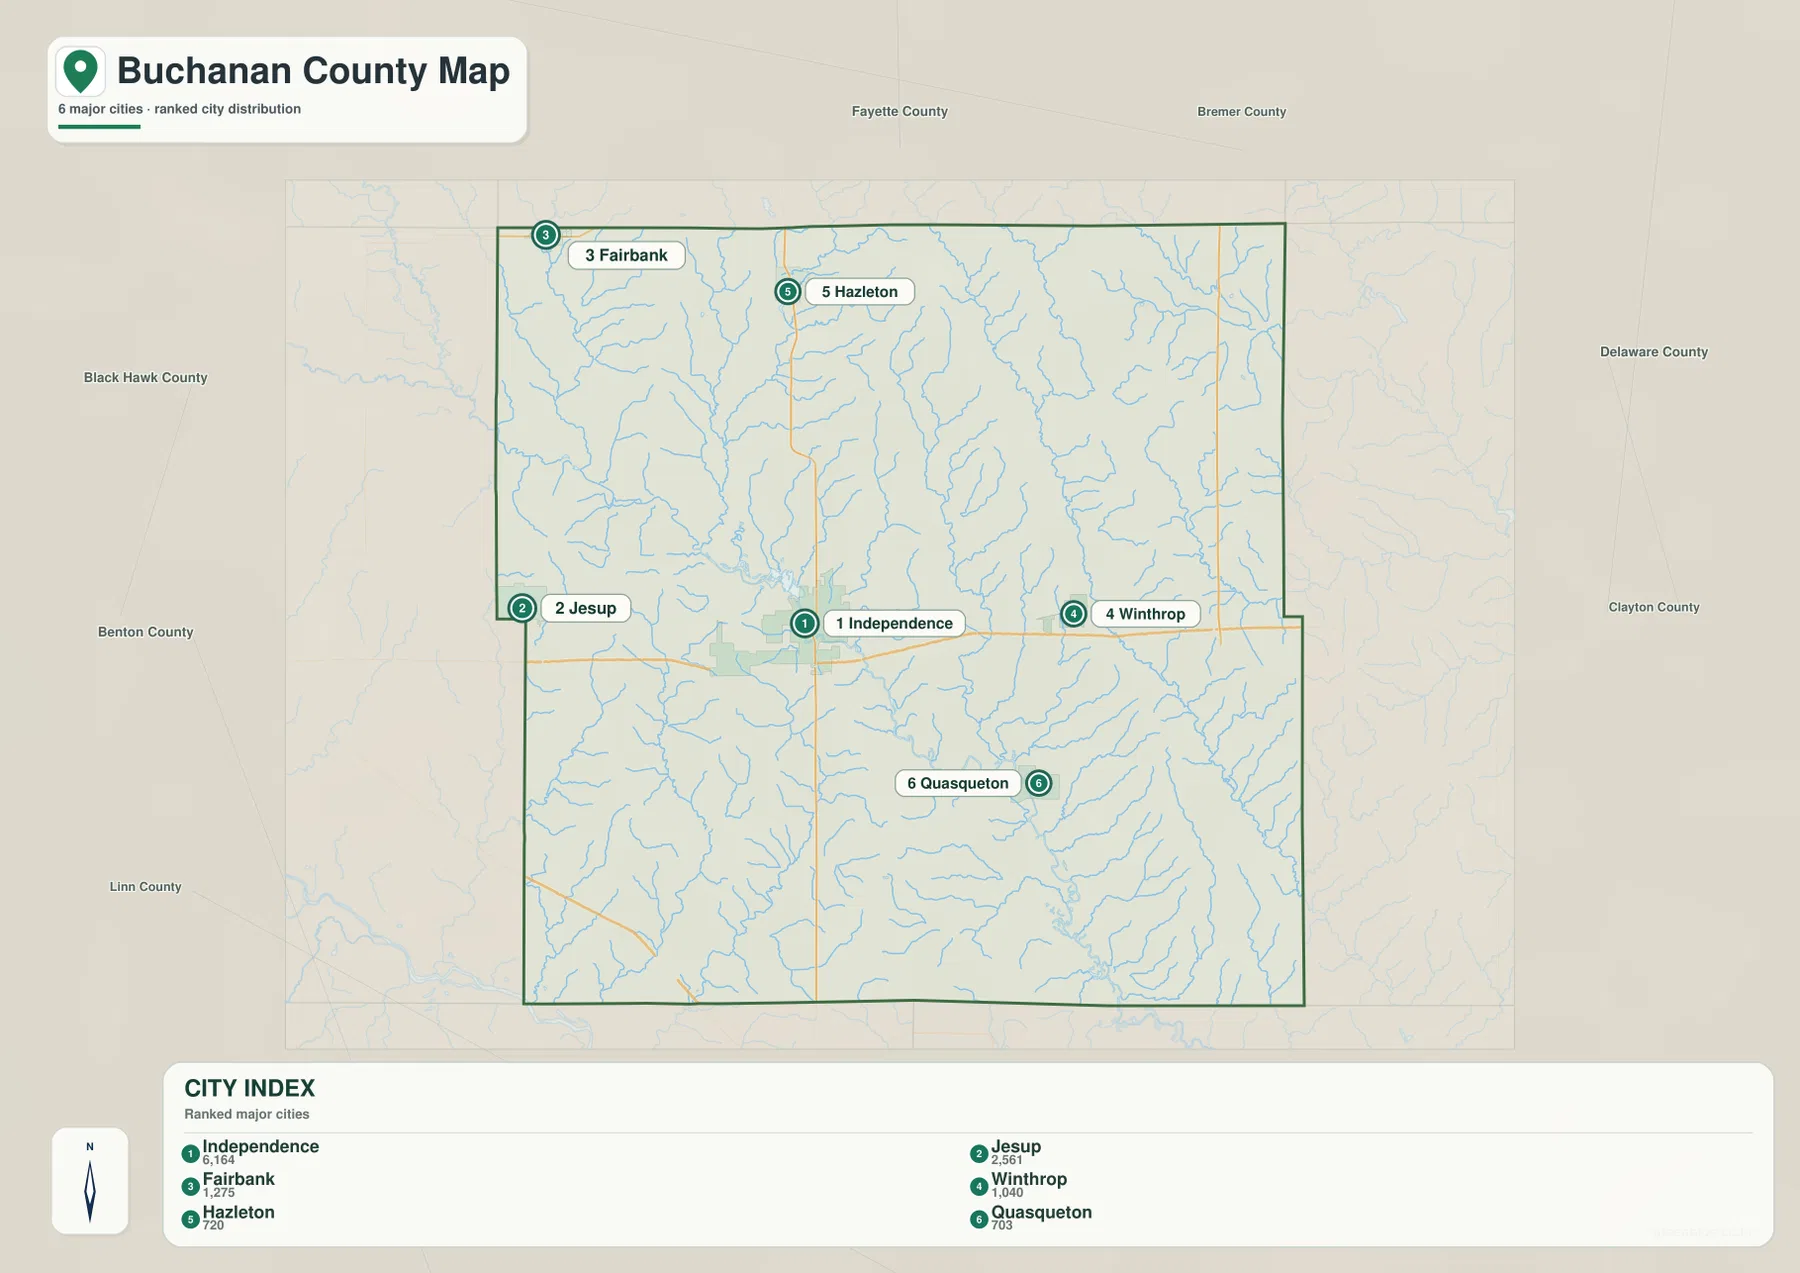
The city map ranks six communities shown in the supplied graphic: Independence, Jesup, Fairbank, Winthrop, Hazleton, and Quasqueton. The index values printed on the map are 6,164 for Independence, 2,561 for Jesup, 1,275 for Fairbank, 1,040 for Winthrop, 720 for Hazleton, and 703 for Quasqueton. These numbers are reproduced from the map itself rather than presented here as newly calculated current population estimates. Anyone who needs an official population for a particular year should check the corresponding Census release.
The distribution matters as much as the ranking. Independence occupies the west-central interior, while Jesup is close to the western edge. Fairbank is near the northwest, Hazleton is farther east in the northern part of the county, Winthrop lies east of Independence, and Quasqueton is to the southeast. The pattern is dispersed: sizable stretches of rural land and stream corridors separate the towns, so the county does not read as one continuous urban area.
Pairing the city map with the road map adds practical context. Independence and Winthrop are easy to compare because both sit along the US 20 corridor. Hazleton can be placed by following Iowa 150 north from Independence, and Jesup provides a clear marker for the western side of the county. Quasqueton is especially useful when locating the southeastern interior, where the water and elevation maps show a more broken pattern of valleys and higher ground.
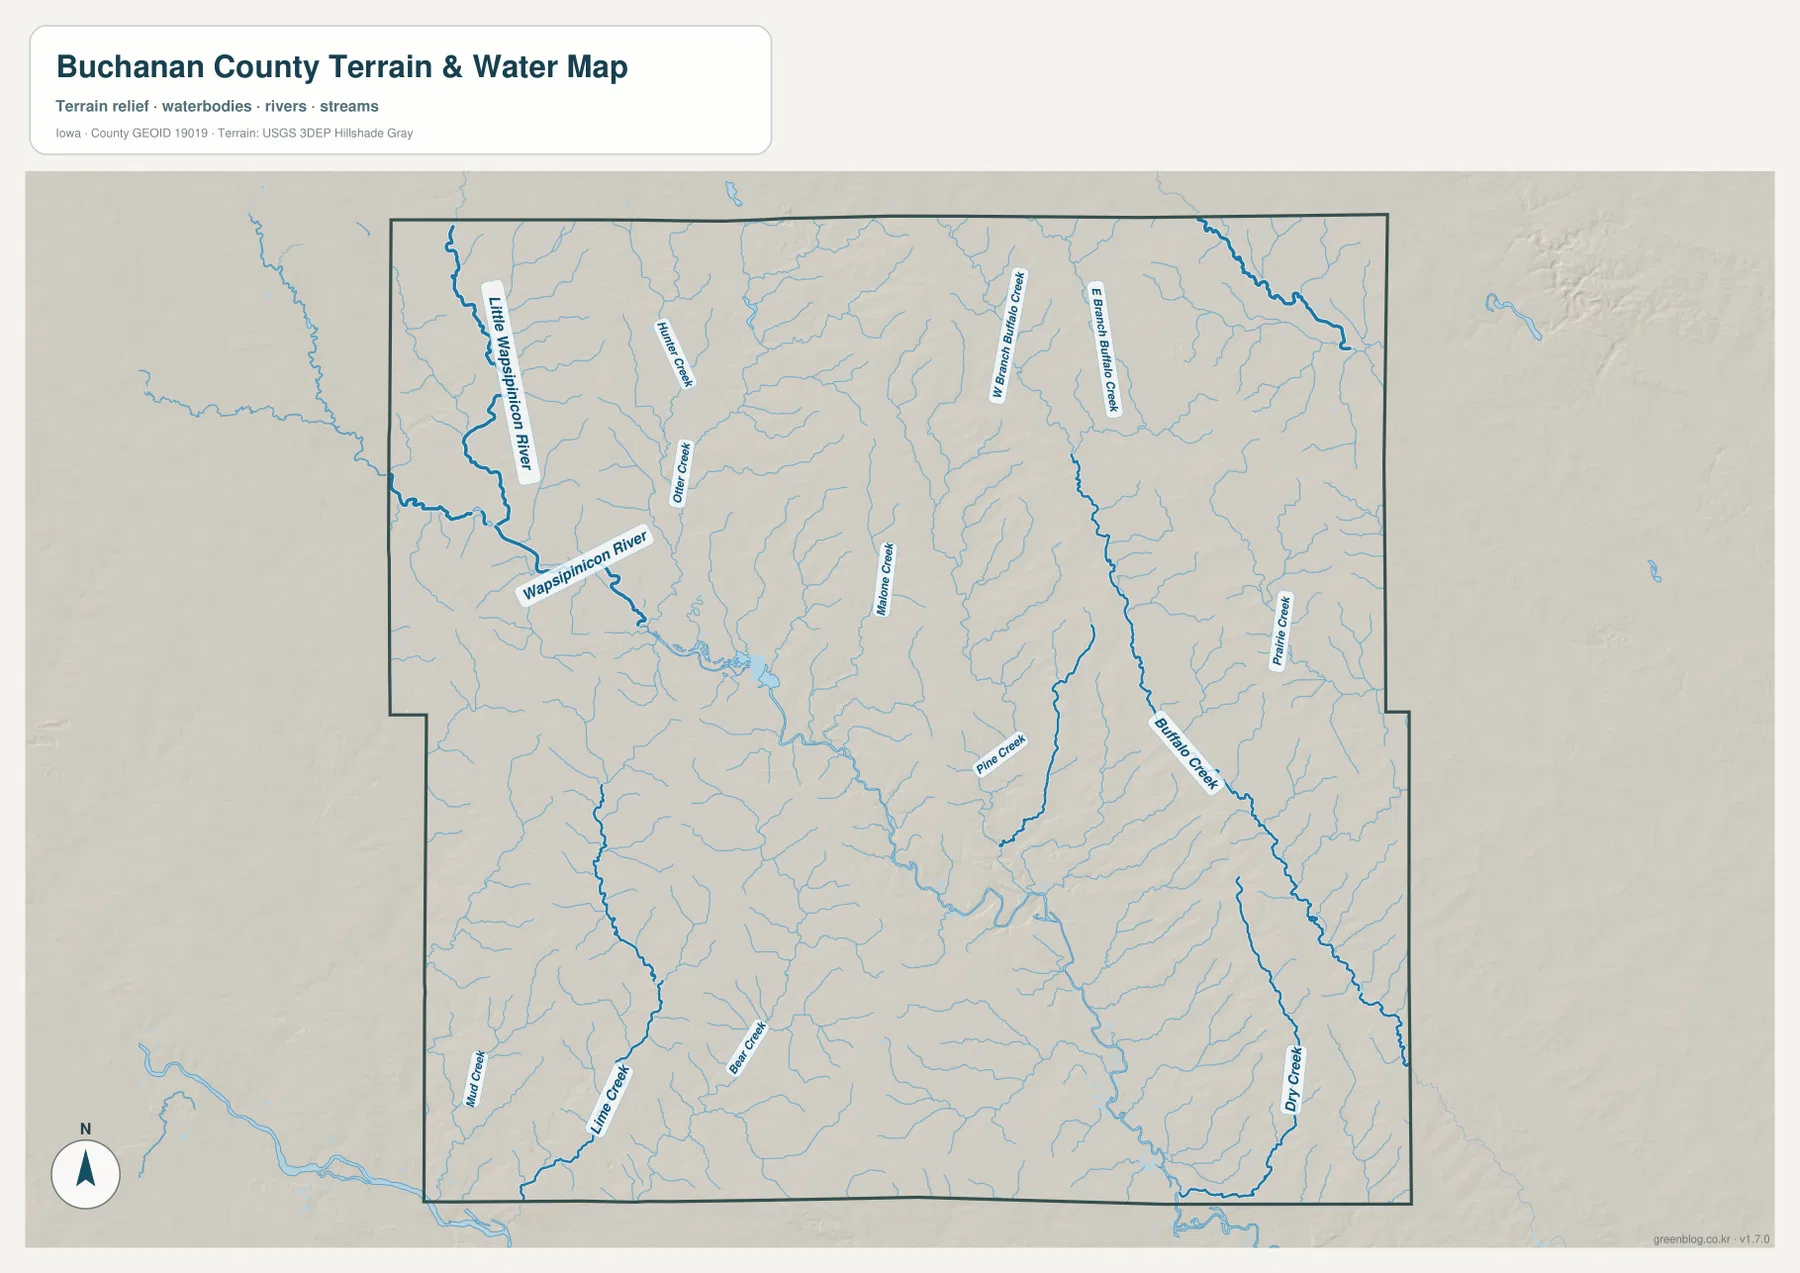
Wapsipinicon River lowlands dominate the west while Buffalo Creek drains the east
The terrain-and-water map gives the western side of Buchanan County a different character from the east. The Wapsipinicon River is the most prominent named river in the western portion, and the Little Wapsipinicon River enters from the northwest. Hunter Creek and Otter Creek are among the smaller labeled streams feeding this side of the county. Around the main river, the relief appears lower and broader, which matches the green valley areas visible on the elevation map.
Eastern Buchanan County is organized by a different network. West Branch Buffalo Creek and E Branch Buffalo Creek descend through the northern and eastern interior, and Buffalo Creek continues southward near the eastern side. Prairie Creek, Pine Creek, and Dry Creek are also labeled on the supplied water map. Instead of one broad dominant valley, this side contains several narrower stream cuts separated by higher ridges and rolling ground.
This is a reference map for the location of rivers, creeks, and surrounding terrain. It is not a flood-hazard map, parcel map, navigation chart, or legal water-boundary document. A stream shown here may have access restrictions or conditions that cannot be determined from a county-scale image. Flood zones, bridge conditions, public access, water levels, and property boundaries should be checked through the appropriate current official source when those details matter.
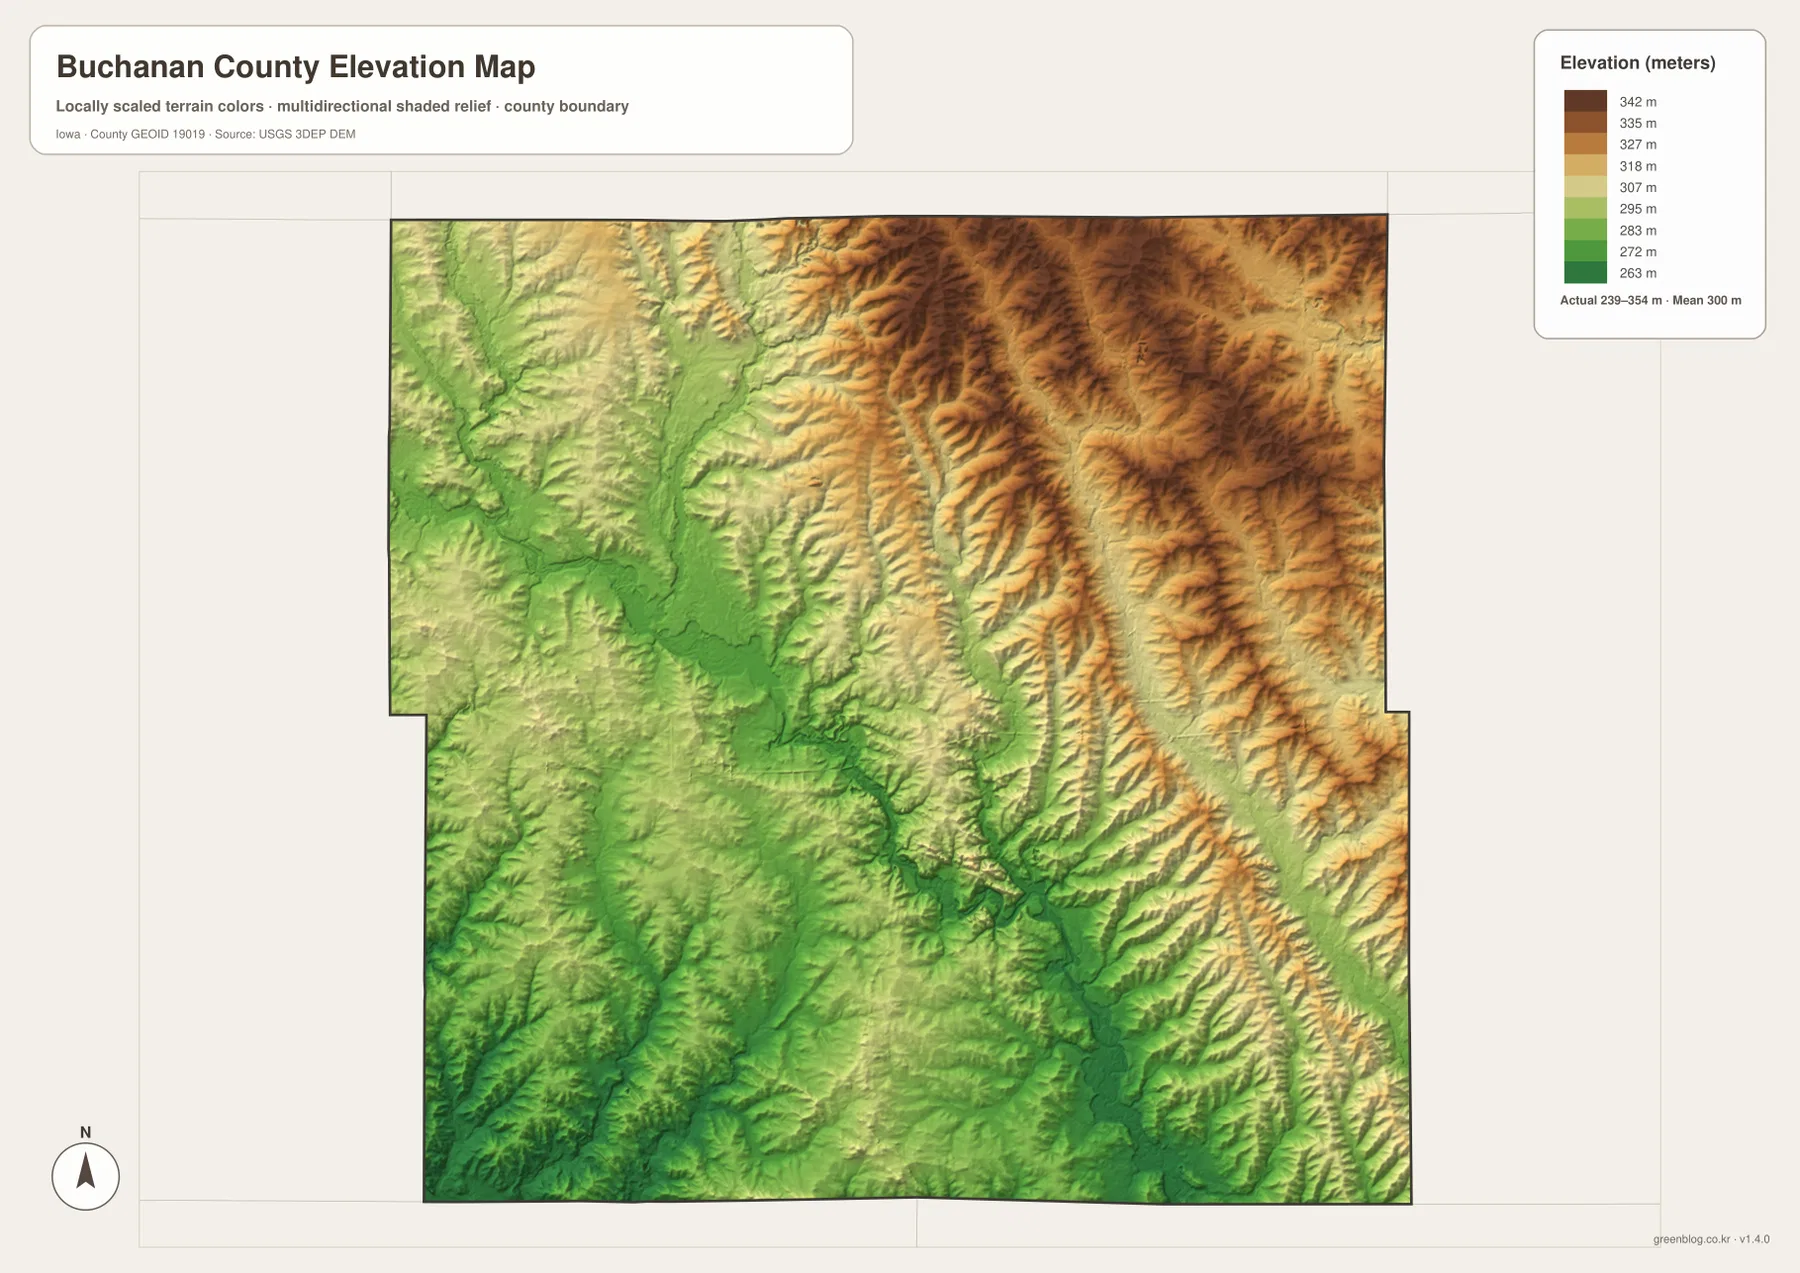
Elevation rises from the western river valleys toward the northeast and east
The elevation map makes the county’s broad relief easier to see than the road map does. Its legend reports an actual elevation range of about 239 to 354 meters and a mean near 300 meters. Green shades dominate much of the west and west-central area, especially around the Wapsipinicon River valleys. Tan and brown colors become more common to the northeast and east, where ridges stand above narrower stream valleys.
The eastern high ground is not a single flat block. Long green and yellow valleys cut through the brown terrain, following drainage lines that correspond closely with the creek network on the water map. In the northeast, a series of narrow ridges and valleys creates the strongest relief texture on the map. The southeast also alternates between higher ground and lower drainage corridors, while the southwest generally remains lower and more gently varied.
The colors are best used to compare relative height across the county. A brown area is simply higher within this county-scale range, while a green area is lower; neither color by itself identifies mountains, wetlands, or flood zones. The surface is generalized for county-scale viewing, so it should not be treated as an engineering or survey product. Construction, drainage design, precise site elevation, or legal work requires a more detailed and purpose-specific elevation source.
US 20 and Iowa 150 provide a simple framework for reading the rest of the county
For general orientation, US 20 and Iowa 150 work almost like two reference lines crossing near Independence. US 20 carries the eye across the county from the western side through Independence and Winthrop toward the east. Iowa 150 brings the eye down from the Hazleton area through Independence and continues south. This makes Independence a useful starting point even when the actual destination is one of the smaller towns.
Other numbered roads add detail without overwhelming the map. Iowa 57 and Iowa 187 help distinguish locations in the east, I-380 appears in the southwest near Brandon, and Iowa 281 is labeled along the north. These lines are enough for understanding the county’s broad layout, but they do not replace a current turn-by-turn road map. Construction, closures, local gravel roads, and driveway access can change the route a driver would actually use.
Following US 20 east reveals a clear shift from river lowland to more broken terrain
US 20 looks straightforward on the general map, but the surrounding land changes as the route crosses Buchanan County. Near Independence, the road is close to the Wapsipinicon River system and the broader low ground shown in green on the elevation image. Moving east past Winthrop, tan and brown terrain becomes more common, and drainage valleys cut more distinctly through the higher surface.
That contrast is easy to miss when only roads and town labels are visible. On the western side, the broad river valley is an important part of the landscape. On the eastern side, Buffalo Creek and related tributaries divide higher ground into narrower ridges and valleys. Placing the county map beside the elevation map is therefore a useful way to explain how one east-west highway crosses noticeably different terrain without relying on technical topographic language.
Fairbank, Hazleton, and Quasqueton help define the county beyond Independence
Independence is the largest mapped center, but the outer communities help define Buchanan County’s shape. Fairbank lies close to the northwest corner, while Hazleton is farther east in the northern part of the county and is easy to locate from Iowa 150. Between and south of those places, the maps show a network of small streams crossing a transition from lower western terrain toward higher land in the east.
Quasqueton provides a useful southeastern reference. It sits southeast of Independence rather than directly on the main US 20 line, and the surrounding area contains several drainage valleys visible on both the water and elevation maps. Looking at Quasqueton together with Independence makes it easier to see that a short straight-line separation on a simple locator map does not describe all of the terrain between two places.
Choose the map by the question you are trying to answer
If Buchanan County is unfamiliar, begin with the general map. Find Independence, trace US 20 east and west, then use Iowa 150 to establish north and south. Add Jesup, Winthrop, Hazleton, Fairbank, and Quasqueton after those anchors are clear. The city map is a good second step because it reduces the view to six ranked communities and makes their separation easy to compare.
For rivers or landform questions, reverse the order. Start with the terrain-and-water map, locate the Wapsipinicon River and Little Wapsipinicon River in the west, then compare them with Buffalo Creek and its branches in the east. Move next to the elevation map to see which drainage corridors occupy the lower ground. Returning to the general map at the end lets you connect those physical features to Independence, Winthrop, Quasqueton, and the numbered highways.
The body images are convenient for online reading, but the downloadable JPG files are better when a larger image is needed. Each supplied map is 3638 × 2572 pixels in its high-resolution JPG form. Because the county, city, water-and-terrain, and elevation maps are separate files, a presentation or worksheet can use only the layer of information needed for a particular explanation instead of crowding every subject onto one page.
County-scale reference maps should be separated from legal and engineering sources
These maps are designed to explain Buchanan County at a county-wide scale. They show major towns, through roads, a representative stream network, and broad elevation differences, but they do not contain every local road, building, parcel line, drainage ditch, or contour. The water map should not be interpreted as a flood-zone map, and the elevation surface should not be treated as survey-grade measurement. Legal boundaries, construction decisions, emergency planning, and precise site elevations require the relevant current official dataset.
For orientation, education, regional comparison, and trip planning before detailed navigation, the simplified view is useful. A reader can establish Independence and the two main road directions, compare western Wapsipinicon lowlands with the eastern Buffalo Creek network, and then use elevation colors to understand why the eastern half appears more deeply divided by valleys. Each map answers a different part of that sequence without forcing every feature into one crowded graphic.
Frequently Asked Questions
Which map is best for comparing Independence and Winthrop?
Use the general county map first. Independence is west of Winthrop, and both can be located along US 20, making the east-west relationship easy to see. The city map is useful as a second view because it also shows Independence as the largest community in the supplied six-city index and Winthrop farther east.
Where is the strongest elevation contrast in Buchanan County?
The clearest contrast is between the lower western Wapsipinicon River valleys and the higher northeastern and eastern terrain. The supplied elevation legend reports an actual range of about 239 to 354 meters with a mean near 300 meters. Narrow lower valleys also cut through the higher eastern ground, so the relief is more varied than a simple west-to-east slope.
What is included in the downloadable ZIP?
The archive includes four high-resolution JPG files: the general county map, ranked city map, terrain-and-water map, and elevation map. Each JPG is 3638 × 2572 pixels, providing more room for zooming or printing than the WebP images embedded in the article.
Map File Information
The ZIP contains high-resolution JPG versions of the Buchanan County general map, city map, terrain-and-water map, and elevation map. Download the archive when you need larger files for zooming, printing, presentations, or offline reference.
- File Type: ZIP containing 4 JPG files
Related Maps
Sources and references
For current county information and more detailed boundary, hydrography, and elevation data, consult the following official sources.
- Buchanan County Government – official county information
- U.S. Census Bureau TIGER/Line Shapefiles – county boundaries, roads, and related geographic data
- USGS National Hydrography – rivers, streams, and hydrography data
- USGS 3D Elevation Program – elevation data
Green Map creates custom-edited map images using open geographic data sources such as geoBoundaries, Natural Earth, OpenStreetMap, and government open data.
These maps are edited visual materials, not raw data files, and are provided for education, documents, presentations, and graphic reference.