The 2024 private-consumption purchasing-power-parity conversion factor ranges from 0.18379 to 113,984.90 across the 162 supplied countries and territories. A raw ranking puts Iran and Lebanon at the top and Kuwait, Oman, and Bahrain at the bottom. That ordering is not a ranking of expensive and cheap countries. The unit is local currency units per international dollar, so the denomination of each national currency directly affects the numerical size of the factor.
The World Bank metadata defines a PPP as both a currency conversion factor and a spatial price deflator. It converts currencies to a common unit while removing differences in price levels so that real-volume comparisons can be made. PA.NUS.PRVT.PP is the PPP used for household and NPISH final consumption expenditure, with the U.S. dollar as the base currency.
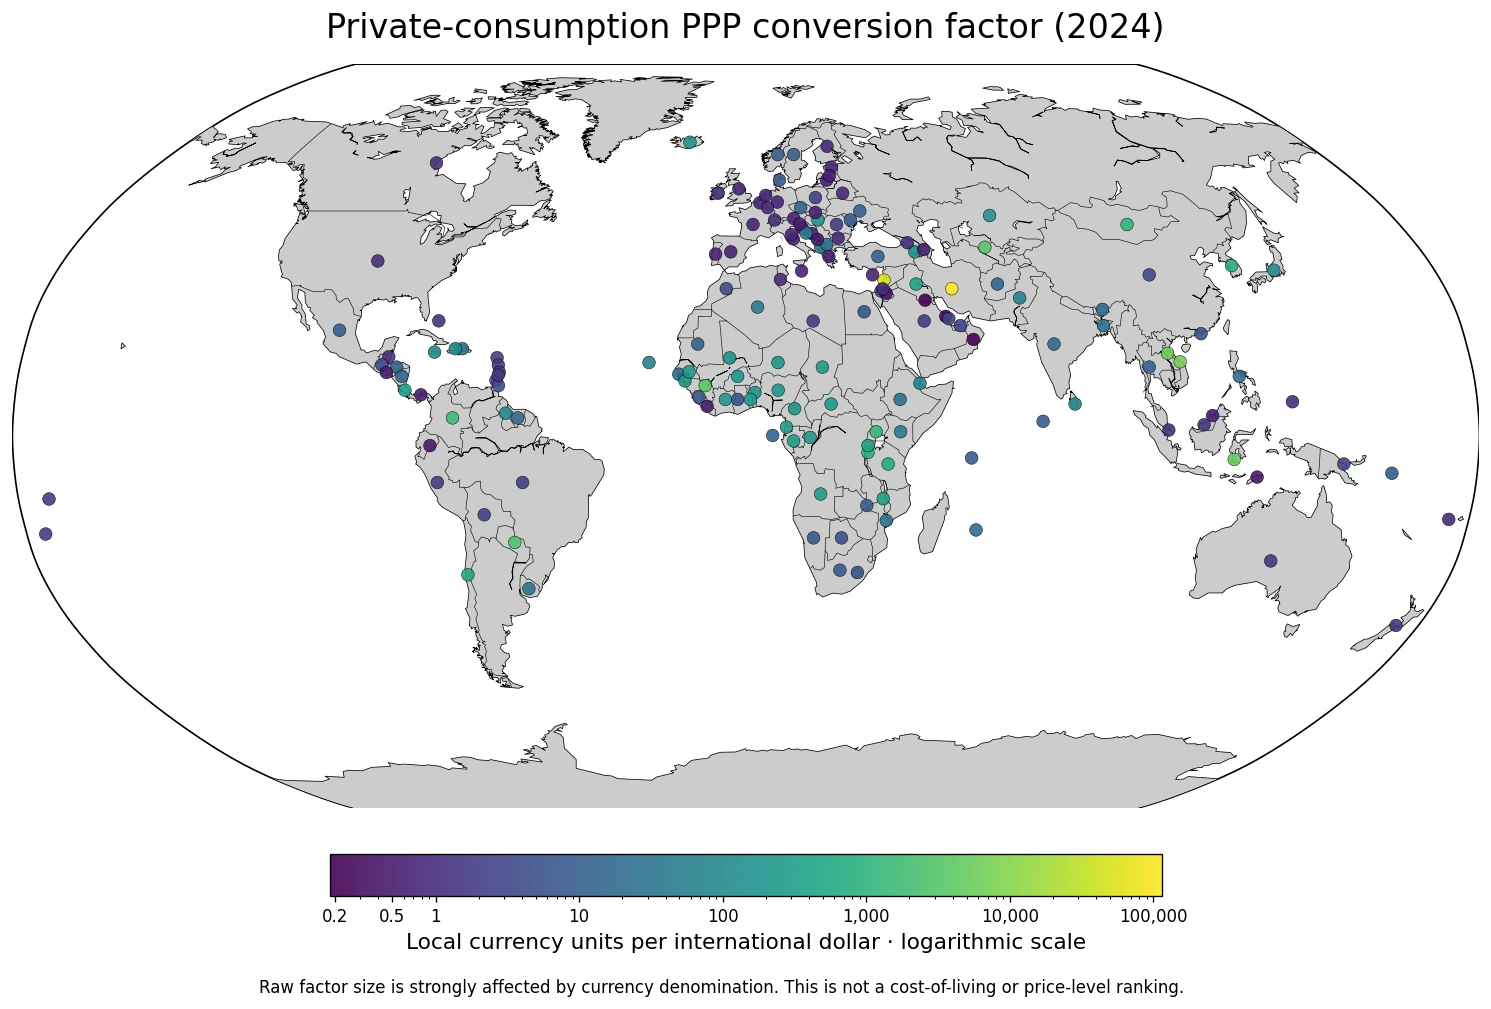
Table of Contents
Iran and Lebanon have huge raw factors, but that does not mean they have the highest consumer prices
Sorting the raw 2024 factors gives Iran at 113,984.90, Lebanon at 52,398.82, Viet Nam at 7,160.71, Laos at 5,595.30, and Indonesia at 5,104.98. Guinea, Uzbekistan, Paraguay, Colombia, Uganda, Mongolia, and Burundi are also above 1,000.
| Raw-factor order | Country or territory | LCU per international dollar |
|---|---|---|
| 1 | Iran (Islamic Republic of) | 113,984.90 |
| 2 | Lebanon | 52,398.82 |
| 3 | Viet Nam | 7,160.71 |
| 4 | Lao People’s Democratic Republic | 5,595.30 |
| 5 | Indonesia | 5,104.98 |
| 6 | Guinea | 3,583.77 |
| 7 | Uzbekistan | 3,372.99 |
| 8 | Paraguay | 2,837.54 |
| 9 | Colombia | 1,638.55 |
| 10 | Uganda | 1,325.72 |
| 11 | Mongolia | 1,116.61 |
| 12 | Burundi | 1,029.51 |
| 13 | Republic of Korea | 872.47 |
| 14 | United Republic of Tanzania | 657.47 |
| 15 | Malawi | 501.74 |
These numbers describe how many units of each country’s own currency correspond to one international dollar for household consumption. Currencies whose individual units have small nominal value can produce very large numerical factors. Iran’s raw number being tens of thousands of times larger than Switzerland’s does not mean the same consumption basket is tens of thousands of times more expensive in Iran.
The United States is 1.0 because the U.S. dollar is the base currency
The United States has a 2024 value of exactly 1.000. China is 3.55079, the United Kingdom 0.70349, Japan 101.18836, India 19.89692, and Switzerland 1.10721. The factor can be used to convert household-consumption expenditure expressed in local currency into international-dollar terms.
Conceptually, dividing a local-currency household-consumption amount by the appropriate PPP conversion factor produces a purchasing-power-adjusted common-unit value. The factor itself is therefore a conversion tool, not an outcome such as household income, consumption volume, inflation, or cost of living.
The smallest raw factors are in Kuwait, Oman, and Bahrain
Kuwait is lowest at 0.18379, followed by Oman at 0.18498 and Bahrain at 0.18867. Jordan is 0.32120, Montenegro 0.42219, Ecuador 0.45022, Timor-Leste 0.45572, and El Salvador 0.48026.
| Low raw-factor order | Country or territory | LCU per international dollar |
|---|---|---|
| 1 | Kuwait | 0.18379 |
| 2 | Oman | 0.18498 |
| 3 | Bahrain | 0.18867 |
| 4 | Jordan | 0.3212 |
| 5 | Montenegro | 0.42219 |
| 6 | Ecuador | 0.45022 |
| 7 | Timor-Leste | 0.45572 |
| 8 | El Salvador | 0.48026 |
| 9 | Liberia | 0.50581 |
| 10 | Croatia | 0.50808 |
| 11 | Panama | 0.51107 |
| 12 | Azerbaijan | 0.52792 |
| 13 | Brunei Darussalam | 0.5429 |
| 14 | Lithuania | 0.54362 |
| 15 | Latvia | 0.54491 |
A factor of 0.18 does not mean prices are 18% of the U.S. price level. To compare price levels directly, a PPP factor has to be considered relative to the market exchange rate. That removes the effect of the currency’s unit denomination and produces a price-level ratio or index.
Direct price-level comparisons require the market exchange rate
The World Bank’s price-level-ratio metadata explains that the price-level ratio is obtained by comparing a PPP conversion factor with the corresponding market exchange rate. That ratio is designed to measure differences in price levels relative to the United States.
The supplied dataset contains the private-consumption PPP conversion factor but not the matching market-exchange-rate series. For that reason, this article does not invent a ‘most expensive country’ ranking. The raw map is used only to show the geographic distribution and enormous numeric range of the conversion factors themselves.
Twelve observations above 1,000 do not form an economic ‘top tier’
Among the 162 observations, 8 are below 0.5, 33 are from 0.5 to below 1, and 48 are from 1 to below 10. Another 32 are from 10 to below 100, 29 from 100 to below 1,000, and 12 are at or above 1,000.
| Raw PPP-factor band | Countries or territories | Share of observations |
|---|---|---|
| Below 0.5 | 8 | 4.9% |
| 0.5–0.999 | 33 | 20.4% |
| 1–9.999 | 48 | 29.6% |
| 10–99.999 | 32 | 19.8% |
| 100–999.999 | 29 | 17.9% |
| 1,000 or more | 12 | 7.4% |
The simple mean is 1,289.18, compared with a median of only 7.44. Iran and Lebanon pull the average sharply upward. The middle half of the distribution runs from 0.995 to 100.14. Those statistics describe the numerical distribution, but there is little economic meaning in treating the mean raw factor as a typical global PPP conversion factor because the currency units themselves differ.
A PPP conversion factor is not a forecast of a currency’s fair exchange rate
Market exchange rates are financial prices influenced by trade, capital flows, interest rates, monetary policy, expectations, and risk. PPP conversion factors are statistical tools designed to make quantities and expenditure aggregates comparable across economies with different price levels.
A gap between a PPP factor and a market exchange rate should therefore not automatically be labelled currency overvaluation or undervaluation. This series is also specific to household and NPISH final consumption, rather than a universal measure of every good, service, asset, or cross-border transaction.
The household-consumption PPP is different from the GDP PPP
World Bank WDI also publishes PA.NUS.PPP for GDP as a whole. GDP includes household consumption, government consumption, investment, and external trade components, each with its own price structure. PA.NUS.PRVT.PP is tailored to household and NPISH final consumption expenditure and is therefore the more direct conversion factor for consumption comparisons.
If the goal is to compare living standards, the factor is normally applied to an expenditure or income aggregate rather than interpreted by itself. PPP-adjusted consumption per person, real survey consumption or income, and poverty measures answer questions about welfare that the raw conversion factor cannot answer alone.
The 2024 series builds on the 2021 ICP benchmark
The World Bank WDI methodology notes that the International Comparison Program produces benchmark PPPs and that the current series is anchored in the 2021 ICP round. WDI extrapolates benchmark PPPs to later years using price and national-accounts information, while Eurostat-OECD economies are updated through their PPP programme.
The 2024 value should therefore not be interpreted as if a completely new global benchmark price survey were independently conducted for every country in that year. PPP series can also be revised when benchmark methods, national accounts, or underlying price data are updated. For most uses, the definition and appropriate application matter more than tiny decimal differences in the raw factors.
This map is a conversion-factor map, not a cost-of-living map
The map colors represent the published 2024 PA.NUS.PRVT.PP raw factors. A logarithmic scale is necessary because the numbers range from about 0.18 to nearly 114,000. Log scaling makes the distribution visible, but it does not make the values directly comparable as national price levels.
A darker point therefore does not mean a country is more expensive, and a lighter point does not mean it is cheaper. The valid question is how many local-currency units are used to convert household final-consumption expenditure into one international-dollar purchasing-power unit. A cost-of-living or price-level comparison requires a different derived measure.
Data scope and source
The comparison uses 162 national-level 2024 observations corresponding to the World Bank World Development Indicators series PA.NUS.PRVT.PP. The current WDI name is ‘PPP conversion factor, households and NPISHs Final consumption expenditure (LCU per international $)’. Rankings, the median, and value bands in this article are calculated directly from the supplied 2024 observations.
Missing countries are not converted to zero. The map places values at representative country locations and uses a logarithmic color scale because of the very wide numerical range. Every interpretation keeps the main limitation visible: raw LCU-per-international-dollar values are affected by currency denomination and are not a direct ranking of price levels.
The main takeaway
The 2024 private-consumption PPP conversion factor ranges from 0.18379 to 113,984.90 across 162 countries and territories. That enormous spread does not mean consumer price levels differ by the same multiple, because the factor is expressed in each country’s own currency units. Its proper role is to convert household final-consumption expenditure into international-dollar values that control for cross-country price-level differences. For direct price-level comparisons, the PPP factor needs to be related to the market exchange rate rather than ranked in isolation.
Frequently Asked Questions
What does the private-consumption PPP conversion factor measure?
It is the conversion factor used to express household and NPISH final-consumption expenditure in international-dollar purchasing-power terms, measured in local currency units per international dollar.
Does a larger PPP conversion factor mean a country has higher prices?
No. Raw values are heavily affected by currency denomination. A direct price-level comparison requires relating the PPP factor to the market exchange rate.
Is the PPP conversion factor a fair-value exchange-rate estimate?
No. PPP is a statistical conversion tool for controlling international price-level differences, not a forecast or target for the market exchange rate.
Related Articles
Green Map creates custom-edited map images using open geographic data sources such as geoBoundaries, Natural Earth, OpenStreetMap, and government open data.
These maps are edited visual materials, not raw data files, and are provided for education, documents, presentations, and graphic reference.