UNESCO Institute for Statistics (UIS) data for 2024 show an enormous spread in the absolute number of out-of-school children and adolescents of primary and lower-secondary school age. Among the 119 countries and territories with an observation, Pakistan has about 11.25 million, India 10.99 million, and Ethiopia 10.77 million. The median observation is only about 28,163. The contrast reflects both the out-of-school rate and the size of each country’s school-age population.
This indicator is an absolute count, not a percentage. It answers how many children and adolescents of official primary and lower-secondary age are out of school. A populous country can therefore have a very large count even when its out-of-school rate is not among the highest, while a small country can have a high rate but a small absolute count. Counts are valuable for understanding the scale of need, but they should be read alongside rates when comparing education access.
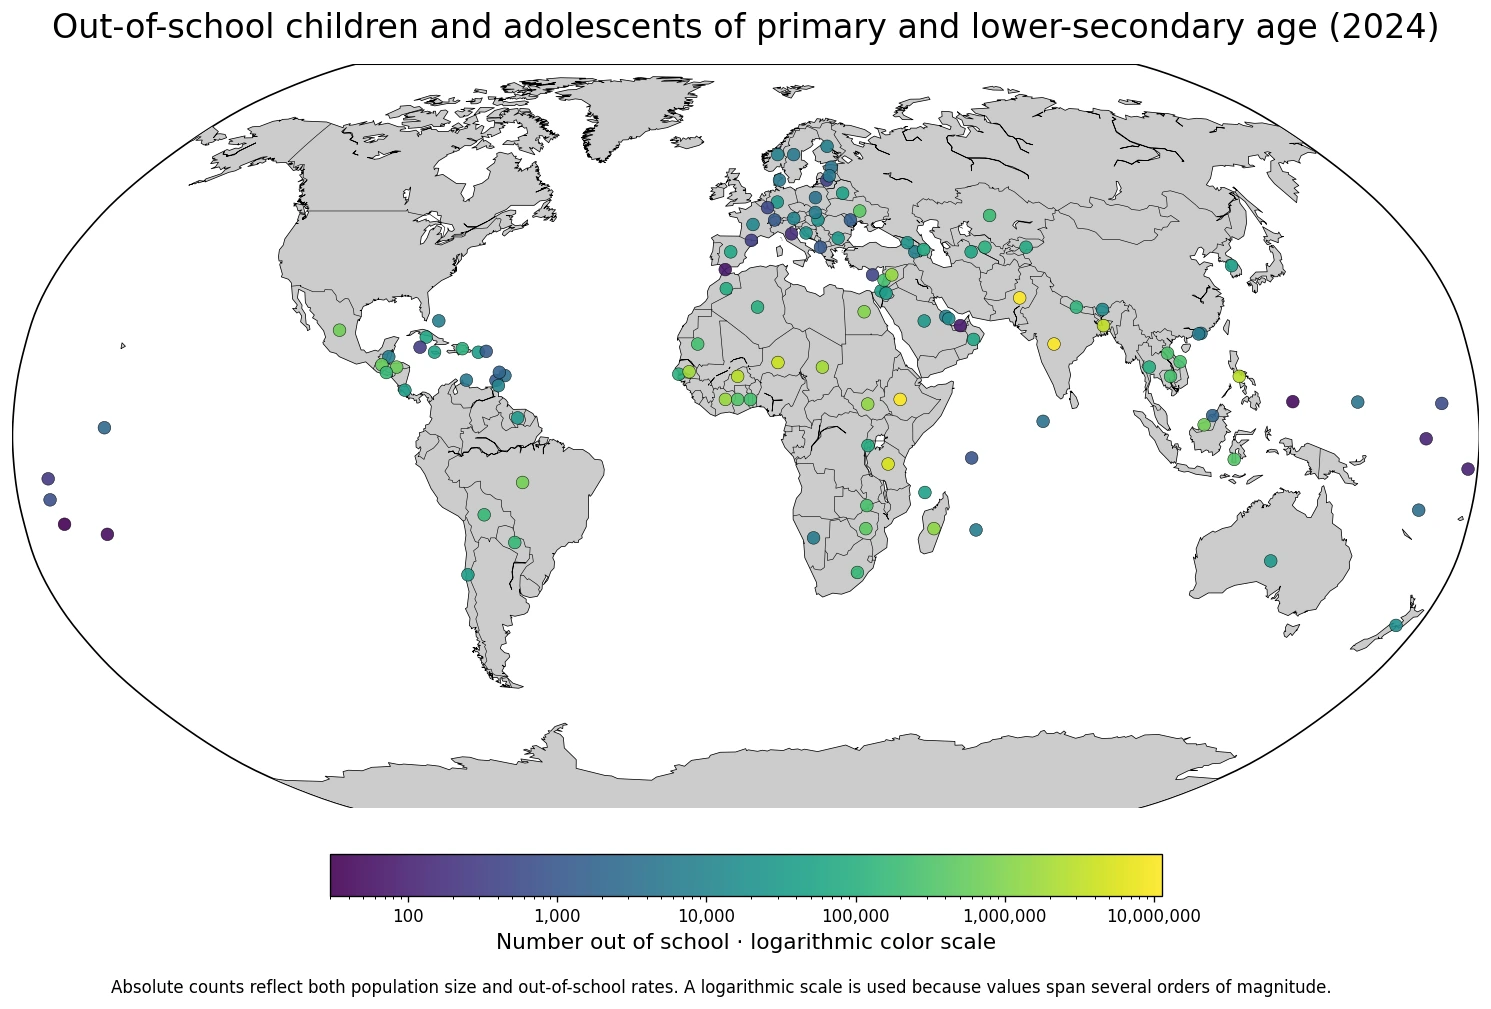
Table of Contents
Pakistan, India, and Ethiopia account for nearly half of the observed total
Adding the 119 supplied observations gives about 71.1 million. This is not a complete world total because the dataset does not contain every country. Within the observed set, Pakistan, India, and Ethiopia together account for about 46.4% of the sum. The ten largest observations account for about 77.1%, showing how strongly the absolute-count distribution is concentrated.
Pakistan has about 11.25 million out-of-school children and adolescents in the covered age range, India about 10.99 million, and Ethiopia about 10.77 million. Tanzania follows at about 5.13 million, Niger at 3.99 million, Bangladesh at 3.26 million, the Philippines at 2.85 million, and Burkina Faso at 2.77 million. Chad and Senegal are also near or above two million.
| High-count order | Country or territory | Out-of-school children and adolescents |
|---|---|---|
| 1 | Pakistan | 11,247,713 |
| 2 | India | 10,986,759 |
| 3 | Ethiopia | 10,771,896 |
| 4 | United Republic of Tanzania | 5,128,671 |
| 5 | Niger | 3,986,319 |
| 6 | Bangladesh | 3,262,198 |
| 7 | Philippines | 2,850,792 |
| 8 | Burkina Faso | 2,774,148 |
| 9 | Chad | 1,996,497 |
| 10 | Senegal | 1,794,967 |
| 11 | Côte d’Ivoire | 1,581,661 |
| 12 | Syrian Arab Republic | 1,471,681 |
| 13 | South Sudan | 1,321,230 |
| 14 | Madagascar | 1,288,058 |
| 15 | Egypt | 1,031,810 |
Fifteen observations are above one million
15 of the 119 countries and territories have at least one million out-of-school children and adolescents in this age range. 5 are between 500,000 and one million, while 20 are between 100,000 and 500,000. At the opposite end, 47 observations are below 10,000. The absolute-count metric therefore spans several orders of magnitude.
| Count band | Countries or territories | Share of observations |
|---|---|---|
| Below 10,000 | 47 | 39.5% |
| 10,000–99,999 | 32 | 26.9% |
| 100,000–499,999 | 20 | 16.8% |
| 500,000–999,999 | 5 | 4.2% |
| 1 million or more | 15 | 12.6% |
The middle half of the observations lies between about 4,389 and 249,028, while the mean is about 597,362 and the median only 28,163. The mean is much higher because a small number of very populous or high-exclusion countries contribute millions of children each. For a typical country in this dataset, the median is a more representative summary than the mean.
Counts and rates answer different policy questions
An absolute count describes the scale of the population currently outside school. It is highly relevant when estimating how many school places, teachers, transport services, outreach programmes, or financial resources may be needed. An out-of-school rate asks what share of the relevant age group is not in school. That percentage is often better for comparing the intensity of exclusion across countries of very different population sizes.
India illustrates the distinction. Its count can exceed ten million because the primary and lower-secondary age population is very large. The count alone does not reveal what percentage of that population is out of school. Conversely, a small island country can have only a few hundred out-of-school children while still facing a meaningful exclusion rate relative to its small school-age population.
Large absolute counts stand out in South Asia and Sub-Saharan Africa
The map shows especially large counts across parts of South Asia and Sub-Saharan Africa. Pakistan, India, and Bangladesh are among the largest observations in South Asia, while Ethiopia, Tanzania, Niger, Burkina Faso, Chad, Senegal, Côte d’Ivoire, South Sudan, and Madagascar are prominent in Africa.
The pattern is not confined to those regions. The Philippines, Syria, Brazil, Mexico, Honduras, and Guatemala also have large counts. Geography helps identify clusters of high absolute need, but similar count levels can arise from very different combinations of population size, school participation, conflict, poverty, and access to education. The indicator itself does not identify the cause.
The smallest counts mostly occur in small countries and territories
At the low end are Niue with 30, Palau with about 44, the Cook Islands with about 49, Gibraltar with 66, the United Arab Emirates with 75, Tuvalu with about 99, Nauru with about 101, and San Marino with 153. These small numbers should not be interpreted as proof that exclusion is unimportant. In a very small education system, a few dozen children can still represent a substantial share of the relevant age group.
| Low-count order | Country or territory | Out-of-school children and adolescents |
|---|---|---|
| 1 | Niue | 30 |
| 2 | Palau | 44 |
| 3 | Cook Islands | 49 |
| 4 | Gibraltar | 66 |
| 5 | United Arab Emirates | 75 |
| 6 | Tuvalu | 99 |
| 7 | Nauru | 101 |
| 8 | San Marino | 153 |
| 9 | Tokelau | 269 |
| 10 | Cayman Islands | 313 |
| 11 | Andorra | 358 |
| 12 | Lithuania | 371 |
| 13 | Cyprus | 435 |
| 14 | Luxembourg | 474 |
| 15 | Marshall Islands | 555 |
Absolute counts are therefore especially sensitive to national population size. Small island states and territories will almost always look small beside large countries on a count map. A rate map can tell a very different story, so the two types of indicator should be used together rather than treated as competing rankings.
A low rate can still produce a large count in a populous country
The denominator is invisible in an absolute-count indicator. If a country has a very large population of primary and lower-secondary age, even a few percentage points out of school can translate into hundreds of thousands or millions of children. A smaller country may have a higher exclusion rate but a much smaller count.
This is why the question ‘which country has the worse problem?’ cannot be answered responsibly from the count alone. A large count can signal the largest programme scale, while a high rate can signal a more severe proportionate access problem. The right metric depends on whether the decision concerns total resources, equity, or the probability that a child of school age is excluded.
National totals can hide large inequalities inside countries
A national count aggregates children across cities, rural areas, wealth groups, conflict zones, and demographic groups. It does not show where within a country the out-of-school population is concentrated. Gender, disability, household income, displacement, distance to school, and local security can all affect exclusion even when the national total is known.
The country map is therefore a first-stage global comparison. Designing policy requires subnational and disaggregated evidence. This analysis does not infer district-level patterns or causes beyond what is present in the national UIS data.
A mid-range country example shows how scale changes interpretation
The Republic of Korea has a 2024 observation of 41,500, above the dataset median of about 28,163 but far below the multi-million counts at the top. That number by itself is not a sufficient measure of education access because the size of the relevant age population and the out-of-school rate are needed to interpret it properly.
The sum of the 119 observations is not a world total
The supplied observations add to roughly 71.1 million, but the dataset covers only 119 countries and territories. Countries without a 2024 observation are not assigned zero. The sum is used here only to describe concentration within the observed dataset, such as the share contributed by the largest countries.
This distinction matters whenever international counts are mapped. A missing observation means no value is included in this comparison; it does not mean that the country has no out-of-school children. Treating missing countries as zero would bias both the map and any derived total.
Data scope and source
The analysis uses 119 national-level 2024 observations from the UNESCO Institute for Statistics official API indicator OFST.1T2.CP. The indicator measures the number of out-of-school children and adolescents of official primary and lower-secondary school age, both sexes combined. All totals, medians, count bands, and rankings in this article are calculated directly from those supplied observations.
The map places a point at a representative location for each country or territory. Point size does not encode population or count; color encodes the published value. Because observations range from about 30 to more than 11 million, the map uses a logarithmic color scale. The tables and prose retain the original count values.
The main takeaway
Pakistan, India, and Ethiopia each have roughly eleven million out-of-school children and adolescents of primary and lower-secondary age in the 2024 observations, and together they represent about 46.4% of the observed sum. 15 countries and territories are above one million. Yet an absolute count is strongly shaped by population size, so it should not be treated as a direct ranking of out-of-school rates or education-system performance. Use counts to understand the scale of need and rates to understand the relative level of exclusion.
Frequently Asked Questions
How is this indicator different from the out-of-school rate?
This indicator is an absolute count of out-of-school children and adolescents of official primary and lower-secondary age. A rate measures their share of the relevant age population, so the two indicators answer different questions.
Which country has the largest 2024 count in this dataset?
Pakistan is highest at about 11.25 million, followed by India at about 10.99 million and Ethiopia at about 10.77 million.
Is the sum of the 119 observations a global total?
No. The dataset contains 119 countries and territories, so the sum describes only the observed set and should not be presented as a complete world total.
Related Maps
Green Map creates custom-edited map images using open geographic data sources such as geoBoundaries, Natural Earth, OpenStreetMap, and government open data.
These maps are edited visual materials, not raw data files, and are provided for education, documents, presentations, and graphic reference.