Cross-border services trade can be compared with GDP to show how large two-way services transactions are relative to the domestic economy. Among the 97 countries and areas with World Bank observations dated 2025, the median services trade share of GDP is 21.63% and the simple unweighted mean is 30.78%. Korea is 17.88%. This is not the domestic services sector share of GDP: the numerator adds services exports and services imports.

Table of Contents
The measure tracks cross-border services transactions, not the domestic services sector
World Bank series BG.GSR.NFSV.GD.ZS is titled Trade in services (% of GDP). Its definition adds services supplied by residents to non-residents and services supplied by non-residents to residents, then expresses that total relative to GDP. In practical terms, it is services exports plus services imports divided by GDP. It should not be confused with the share of domestic value added generated by service industries such as health care, retail, finance, education, or real estate.
A value of 20% means that the combined value of services exports and services imports is equivalent to about one-fifth of GDP for that year. Because exports and imports are added, the number does not tell whether a country has a services surplus or deficit. A balance measure would subtract imports from exports instead.
The ratio is best read as a measure of the scale of cross-border services transactions relative to the economy. Economies with large international finance, business services, travel, transport, or other cross-border services can record high values, but this single aggregate does not identify which service category is responsible. Category-level balance-of-payments data are needed for that question.
The 2025 median is 21.63%, with the middle half between 13.32% and 33.82%
Giving each of the 97 2025 observations equal weight, the median is 21.63% and the mean is 30.78%. The first quartile is 13.32% and the third quartile is 33.82%, so the middle half of observations falls in a band of roughly 13.3% to 33.8% of GDP. The mean is well above the median because a few observations above 100% create a long upper tail.
| 2025 services trade / GDP | Countries/areas | Share of 97 |
|---|---|---|
| Below 10% | 20 | 20.6% |
| 10% to <20% | 22 | 22.7% |
| 20% to <30% | 24 | 24.7% |
| 30% to <50% | 20 | 20.6% |
| 50% to <100% | 8 | 8.2% |
| 100% or more | 3 | 3.1% |
Twenty observations are below 10%, 22 are between 10% and 20%, and 24 are between 20% and 30%. Another 20 fall between 30% and 50%, eight are between 50% and 100%, and three exceed 100%. The central mass is therefore in the 10% to 30% range, while a small set of highly open or internationally oriented economies sits far above it.
Luxembourg, Cyprus and Singapore exceed 100% of GDP
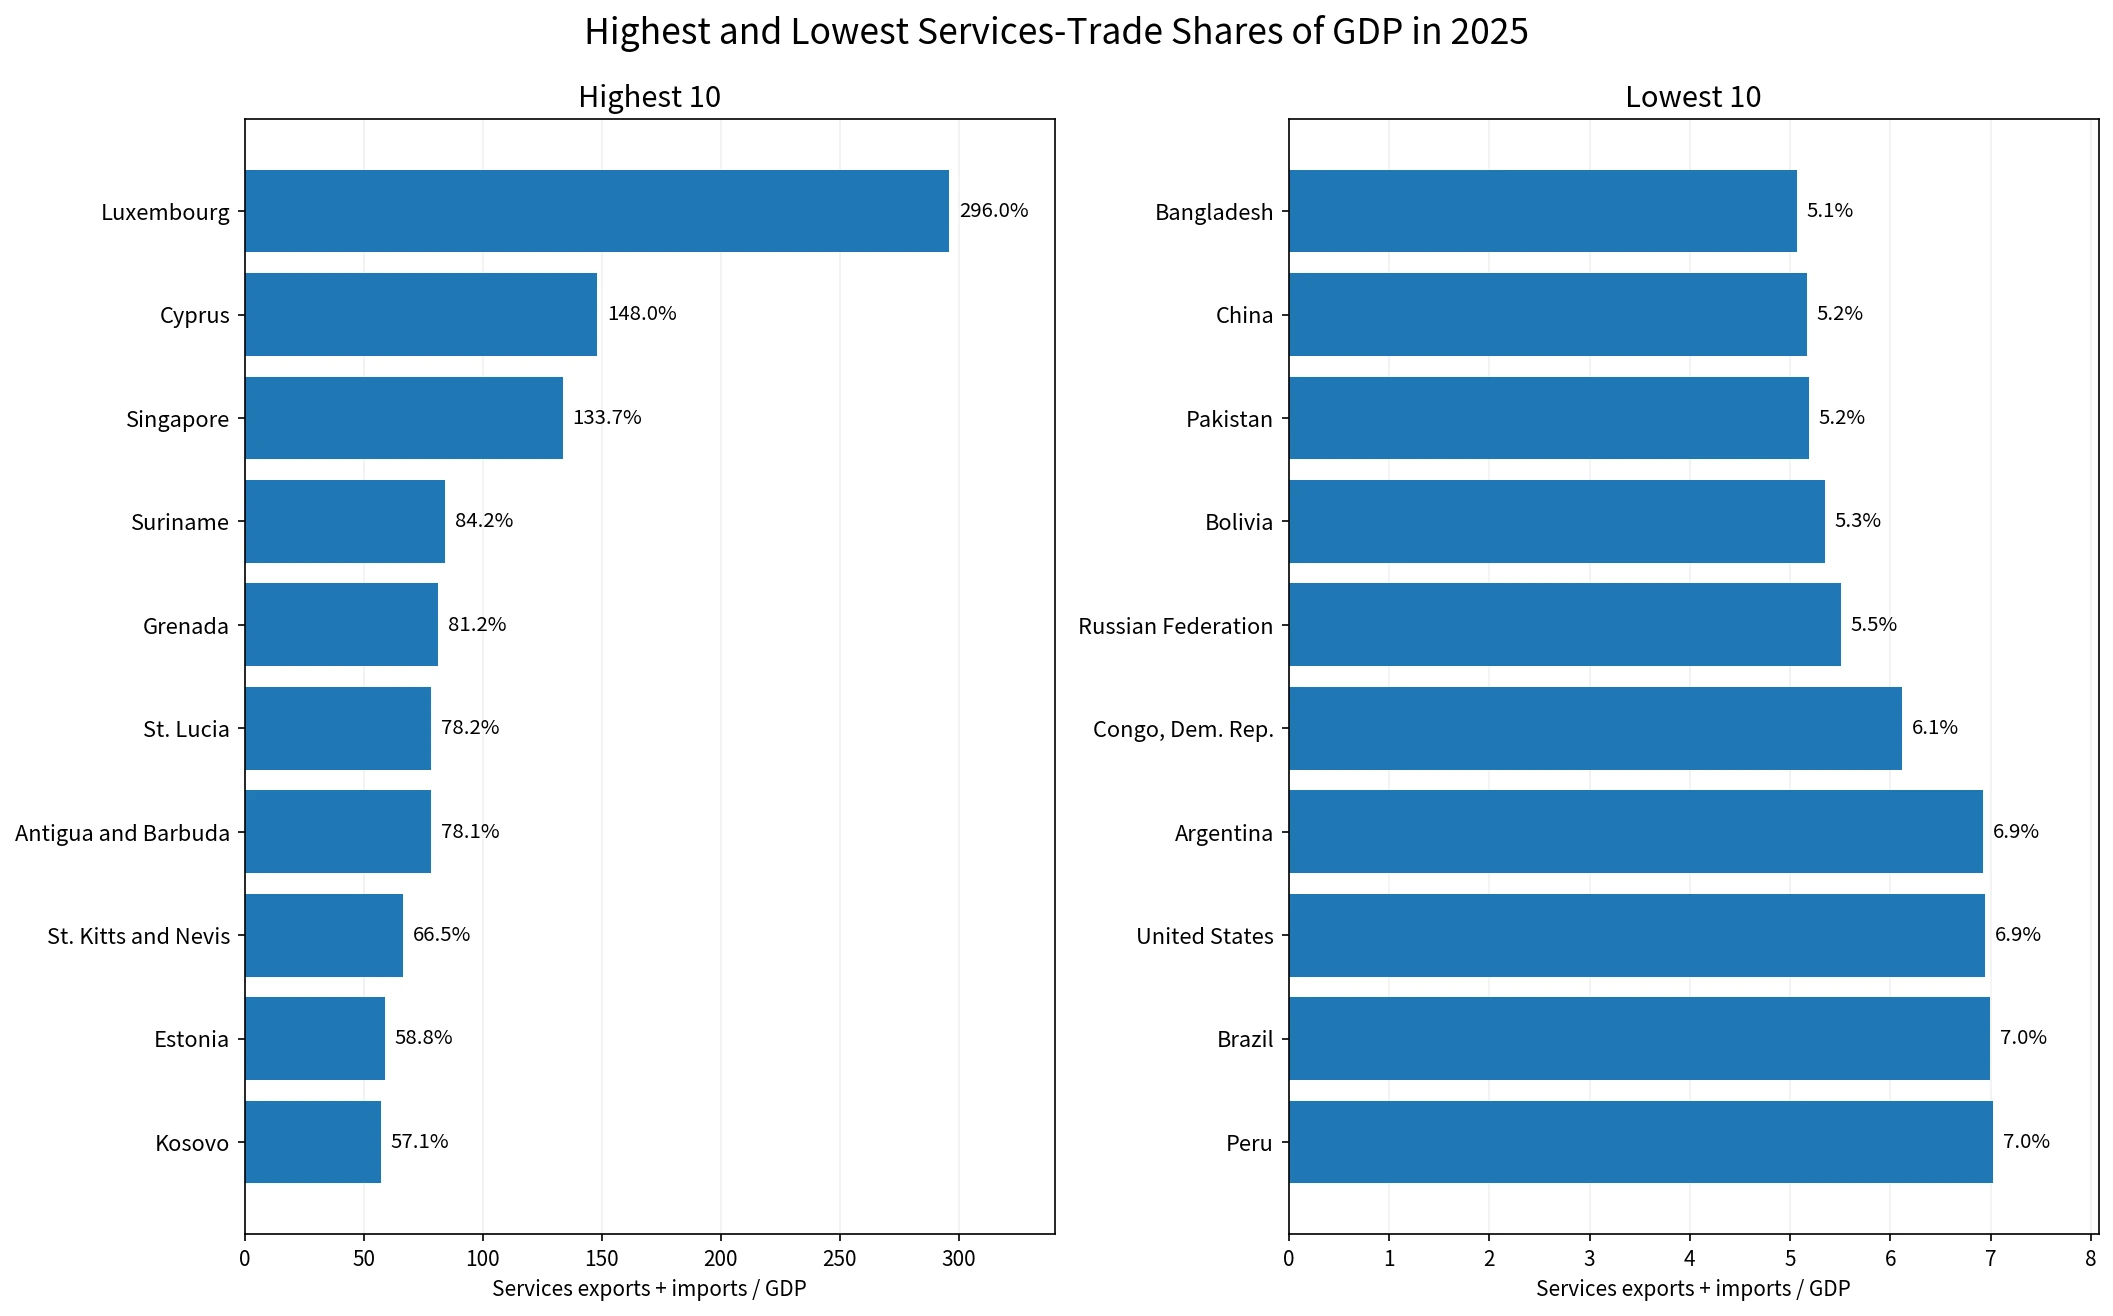
The highest 2025 observation is Luxembourg at 295.97%, followed by Cyprus at 148.05% and Singapore at 133.66%. Suriname is 84.19%, Grenada 81.20%, Saint Lucia 78.16%, Antigua and Barbuda 78.09%, and St. Kitts and Nevis 66.53%. Estonia records 58.83% and Kosovo 57.07%.
| Highest country/area | Services trade / GDP |
|---|---|
| Luxembourg | 295.97% |
| Cyprus | 148.05% |
| Singapore | 133.66% |
| Suriname | 84.19% |
| Grenada | 81.20% |
| St. Lucia | 78.16% |
| Antigua and Barbuda | 78.09% |
| St. Kitts and Nevis | 66.53% |
| Estonia | 58.83% |
| Kosovo | 57.07% |
At the other end, Bangladesh is 5.07%, China 5.17%, Pakistan 5.19%, Bolivia 5.34%, and the Russian Federation 5.51%. The Democratic Republic of the Congo is 6.11%, Argentina 6.93%, the United States 6.94%, Brazil 7.00%, and Peru 7.02%. These low ratios do not mean that the countries have small domestic services industries; they mean cross-border services exports plus imports are relatively small compared with GDP.
| Lowest country/area | Services trade / GDP |
|---|---|
| Bangladesh | 5.07% |
| China | 5.17% |
| Pakistan | 5.19% |
| Bolivia | 5.34% |
| Russian Federation | 5.51% |
| Congo, Dem. Rep. | 6.11% |
| Argentina | 6.93% |
| United States | 6.94% |
| Brazil | 7.00% |
| Peru | 7.02% |
Why the ratio can be larger than 100% of GDP
GDP measures value added produced inside an economy, while the numerator is a gross two-way flow. Services exports and services imports are both counted. If services exports equal 80% of GDP and services imports equal 70%, the indicator can reach 150%. That does not mean services industries produced value added equal to 150% of GDP.
Small open economies, international financial and business-service centers, and economies with large cross-border travel or transport flows can have gross services transactions that are very large relative to domestic GDP. Large economies can show a much lower ratio even when the absolute value of their services trade is enormous, because the GDP denominator is also large.
Luxembourg at 295.97% is therefore not a claim that its services sector is almost three times the size of GDP. The indicator is closer to an openness measure for gross services flows. A high value also does not automatically mean a trade surplus, stronger living standards, or better economic performance.
Korea is 17.88%, below the 2025 median
Korea records 17.88% in 2025, about 3.74 percentage points below the same-year median of 21.63%. Japan is 11.62%, China 5.17%, India 15.54%, Singapore 133.66%, Thailand 26.58%, the Philippines 18.42%, and Indonesia 7.30%. The spread within Asia is therefore much larger than a single regional label would suggest.
| Country | 2025 services trade / GDP |
|---|---|
| Korea, Rep. | 17.88% |
| Japan | 11.62% |
| China | 5.17% |
| India | 15.54% |
| Singapore | 133.66% |
| Thailand | 26.58% |
| Philippines | 18.42% |
| Indonesia | 7.30% |
| United States | 6.94% |
| Canada | 14.70% |
| Mexico | 7.61% |
| Brazil | 7.00% |
| Germany | 22.17% |
| France | 23.73% |
| United Kingdom | 29.22% |
| Spain | 20.05% |
| Italy | 13.54% |
| South Africa | 9.32% |
The United States is 6.94%, Canada 14.70%, Mexico 7.61%, and Brazil 7.00%. In Europe, Germany is 22.17%, France 23.73%, the United Kingdom 29.22%, Spain 20.05%, and Italy 13.54%. Large economies are generally far below outliers such as Luxembourg and Singapore when gross services flows are scaled by GDP.
Korea’s 17.88% is not inherently good or bad. A lower ratio can reflect smaller services flows, a larger GDP denominator, or both. Understanding a change over time requires looking separately at services exports, services imports, and GDP rather than treating the ratio as a one-number performance score.
The map contrasts high European and Caribbean values with lower ratios in many large economies
Within Europe, Luxembourg (295.97%) and Cyprus (148.05%) are major outliers. Estonia is 58.83%, Lithuania 48.63%, and Montenegro 46.69%, while Italy is only 13.54% and Germany, France, and the United Kingdom lie in the low-20s to high-20s. Geography alone does not determine the ratio.
Asia is similarly mixed. Singapore stands at 133.66%, compared with Thailand at 26.58%, the Philippines at 18.42%, Korea at 17.88%, India at 15.54%, Japan at 11.62%, China at 5.17%, and Indonesia at 7.30%. Neighboring economies can occupy very different positions because their cross-border services activity and GDP scale differ.
In the Americas, Suriname is high at 84.19%, and several Caribbean economies also appear near the top. By contrast, the United States (6.94%), Brazil (7.00%), Argentina (6.93%), Peru (7.02%), and Mexico (7.61%) are all in the single digits. The map is useful for locating these clusters and contrasts, but it does not prove a single industry-level cause.
Services trade, total trade and the trade balance answer different questions
Several trade ratios look similar but use different arithmetic. This article uses (services exports + services imports) / GDP. A total-trade ratio uses (goods-and-services exports + goods-and-services imports) / GDP. A goods-and-services balance uses (goods-and-services exports − goods-and-services imports) / GDP. The first measures gross services activity, the second broad gross trade, and the third the net difference between exports and imports.
| Indicator | Basic calculation | What it shows |
|---|---|---|
| Services trade / GDP | Services exports + services imports | Scale of cross-border services transactions |
| Total trade / GDP | Goods-and-services exports + imports | Overall goods-and-services trade openness |
| Goods-and-services balance / GDP | Goods-and-services exports − imports | Whether exports or imports are larger, and by how much |
A country can therefore have a very high services-trade ratio and only a small net balance if services exports and imports are both large and similar in size. Conversely, a smaller gross flow can still generate a noticeable balance if exports and imports differ sharply. The measures complement one another rather than replacing one another.
Why the article does not rank all 200 latest observations together
The source table contains the latest non-empty value for 200 countries and areas, but the reference years are mixed. There are 97 observations from 2025, 68 from 2024, 14 from 2023, and 21 from 2022 or earlier. The oldest latest observations include 1994 values for the Central African Republic and Chad. Treating all 200 as one current ranking would mix very different time periods.
For that reason, the map, median, mean, distribution, and top/bottom rankings in this article use only the 97 observations explicitly dated 2025. The 200-row latest-available table is still useful for understanding coverage, and the 68 observations from 2024 could support a separate same-year analysis, but they are not inserted into the 2025 ranking.
The statistical source is World Bank World Development Indicators series BG.GSR.NFSV.GD.ZS. The World Bank metadata glossary defines total trade in services as services provided by residents to non-residents plus services provided by non-residents to residents, expressed as a percentage of GDP. The cited sources include IMF balance-of-payments data, World Bank WDI, and OECD national accounts data.
Frequently Asked Questions
What does services trade as a share of GDP measure?
It adds services exports and services imports and divides the total by GDP. It measures gross cross-border services transactions, not the domestic services sector share of GDP.
Can services trade exceed 100% of GDP?
Yes. Exports and imports are both counted in the numerator, so highly open or small economies can have two-way services flows larger than annual GDP.
What is Korea’s 2025 services-trade share of GDP?
Korea is about 17.88% in the 2025 World Bank observation used here, below the 21.63% median across the 97 same-year observations.
Is this the same as the goods-and-services trade balance?
No. This indicator adds services exports and imports. A trade-balance indicator subtracts imports from exports and therefore measures a net difference rather than gross two-way activity.
Related Articles
- Goods-and-Services Trade Balance as a Share of GDP (2025)
- Short-Term External Debt vs Exports: Global Country Map
- External Debt Service Ratio Map: Latest Country Comparison
Green Map creates custom-edited map images using open geographic data sources such as geoBoundaries, Natural Earth, OpenStreetMap, and government open data.
These maps are edited visual materials, not raw data files, and are provided for education, documents, presentations, and graphic reference.