The World Bank indicator NE.IMP.GNFS.ZS reports imports of goods and services as a percentage of GDP. Latest non-empty observations are available for 194 countries and territories. Most are recent: 138 observations are from 2025 and 34 from 2024. A small number are much older, with the oldest latest observation dating to 1960. The full table is therefore a latest-available comparison rather than a complete 2025 global ranking.
The unweighted mean across the 194 observations is 49.89% of GDP and the median is 43.78%. The first quartile is 28.79% and the third quartile 65.21%. 22 economies are at 80% or more, including 8 above 100%, while 16 are below 20%. The distribution reflects very different economic sizes, trade structures, supply chains, and degrees of external integration.
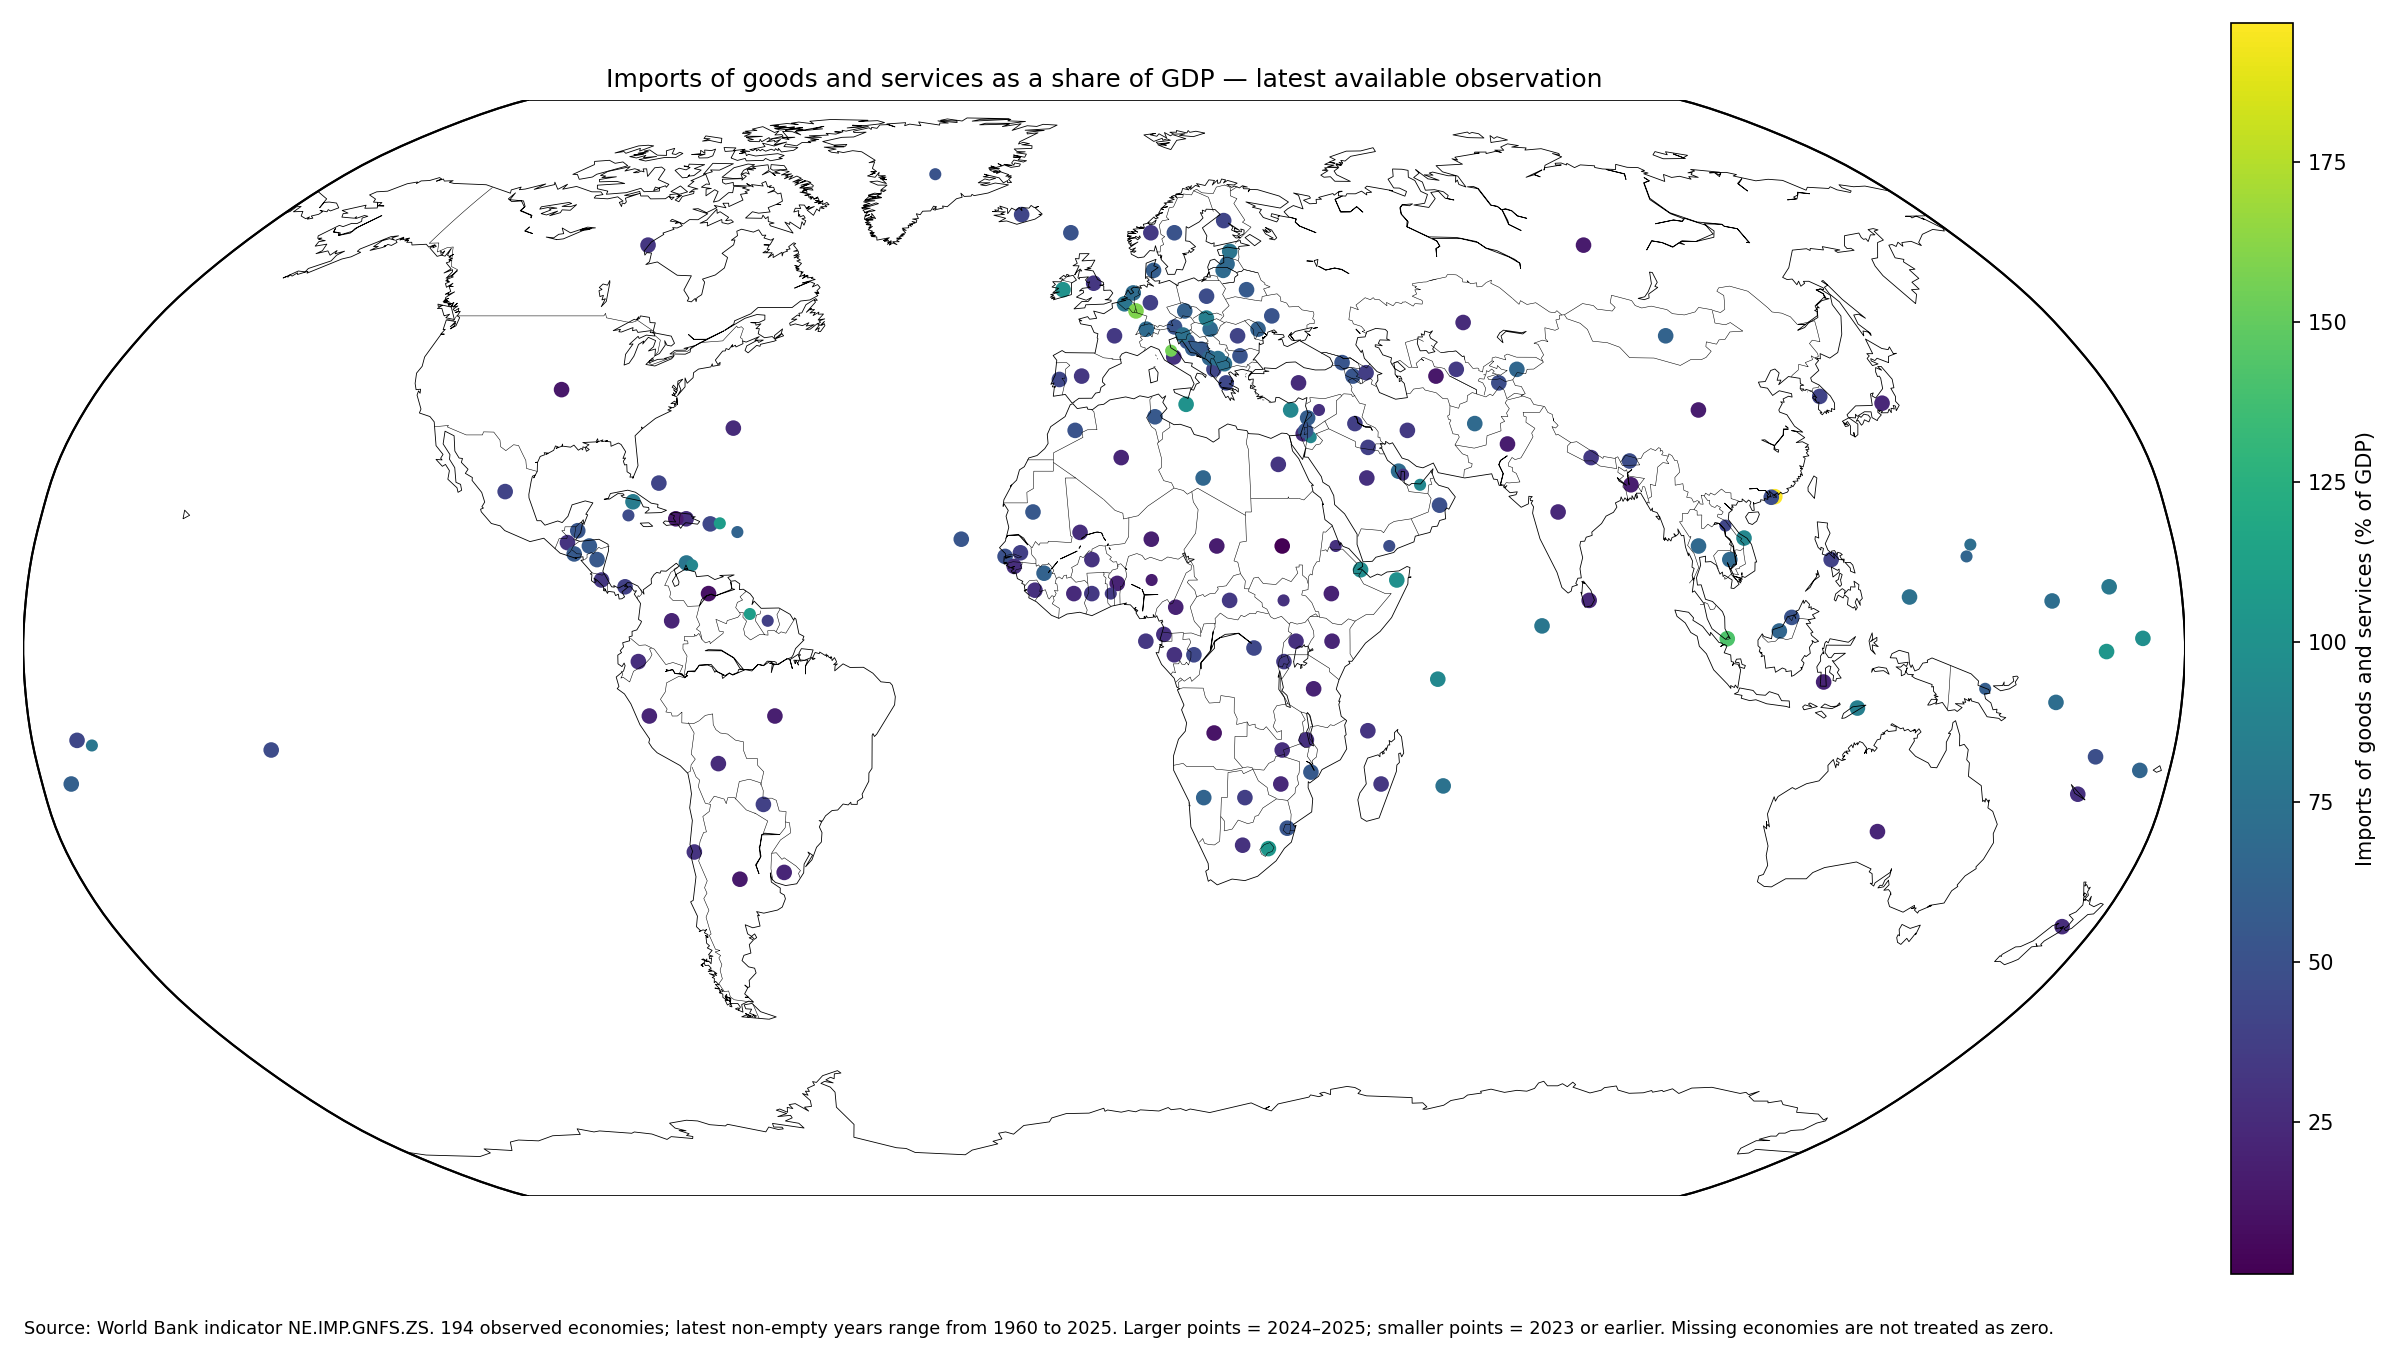
Table of Contents
What imports as a share of GDP measures
The numerator is the value of goods and market services purchased from the rest of the world, while the denominator is gross domestic product. The concept covers more than merchandise crossing a customs border because services trade is included as well. It should therefore not be confused with a merchandise-import tariff measure or a customs-only trade statistic.
The official definition is available in the World Bank metadata glossary, and the World Bank API provides the country observations. Because the indicator divides imports by GDP, it measures imports relative to domestic economic output rather than the absolute dollar size of imports.
Hong Kong SAR and Luxembourg exceed 150% of GDP
Hong Kong SAR has the highest latest observation at 196.89%, followed by Luxembourg at 159.36%, San Marino at 154.99%, and Singapore at 142.45%. Guyana, the U.S. Virgin Islands, Lesotho, and Naoero also exceed 100%.
An import-to-GDP ratio above 100% is mathematically possible because GDP and imports measure different things. GDP records value added produced domestically, whereas imports are gross cross-border transaction values. Highly open economies, re-export hubs, and economies deeply integrated into international supply chains can therefore record imports larger than annual GDP.
| Rank | Country or territory | Observation year | Imports/GDP |
|---|---|---|---|
| 1 | Hong Kong SAR, China | 2025 | 196.89% |
| 2 | Luxembourg | 2025 | 159.36% |
| 3 | San Marino | 2023 | 154.99% |
| 4 | Singapore | 2025 | 142.45% |
| 5 | Guyana | 2005 | 109.73% |
| 6 | Virgin Islands (U.S.) | 2022 | 108.26% |
| 7 | Lesotho | 2025 | 104.45% |
| 8 | Naoero | 2025 | 103.68% |
| 9 | Malta | 2025 | 99.90% |
| 10 | Ireland | 2025 | 99.89% |
| 11 | Somalia, Fed. Rep. | 2025 | 98.81% |
| 12 | Kiribati | 2024 | 97.59% |
| 13 | Djibouti | 2025 | 95.80% |
| 14 | Seychelles | 2025 | 92.67% |
| 15 | United Arab Emirates | 2023 | 92.20% |
The low end falls below 20% of GDP
Sudan has the lowest latest observation at 1.28%. Venezuela is at 10.11%, Angola 11.67%, Turkmenistan 13.70%, the United States 14.04%, Haiti 14.33%, Argentina 14.81%, and the Russian Federation 15.51%.
A low ratio does not by itself mean little international trade or a closed economy. A very large GDP can make substantial import values appear small as a percentage of output, and a large domestic production base can also reduce the ratio. Absolute imports and the import-to-GDP ratio answer different questions.
| Low-end rank | Country or territory | Observation year | Imports/GDP |
|---|---|---|---|
| 1 | Sudan | 2025 | 1.28% |
| 2 | Venezuela, RB | 2025 | 10.11% |
| 3 | Angola | 2025 | 11.67% |
| 4 | Turkmenistan | 2025 | 13.70% |
| 5 | United States | 2024 | 14.04% |
| 6 | Haiti | 2025 | 14.33% |
| 7 | Argentina | 2025 | 14.81% |
| 8 | Russian Federation | 2025 | 15.51% |
| 9 | Chad | 2025 | 16.72% |
| 10 | Bangladesh | 2025 | 16.83% |
| 11 | China | 2025 | 16.89% |
| 12 | Nigeria | 1960 | 16.92% |
The median is 43.78%, below the 49.89% mean
The median of 43.78% describes the middle country-level observation. The mean of 49.89% is about 6.11 percentage points higher because the upper tail contains several observations above 100%.
By broad bands, 16 observations are below 20%, 68 are from 20% to under 40%, 52 are from 40% to under 60%, 36 are from 60% to under 80%, and 22 are at least 80%. The range is wide enough that a single average does not describe most economies well.
Most observations are recent, but a few are very old
2024 and 2025 together account for 172 of the 194 observations. There are 4 from 2023 and 7 from 2022. However, Nigeria’s latest observation in this extract is from 1960, Guyana’s from 2005, Jordan’s from 2007, and Curaçao’s from 2018.
The latest-non-empty method maximizes country coverage, but old values should not be described as current economic structures. For time-sensitive comparisons, filtering to recent years is safer even though the geographic sample becomes smaller.
A 2024–2025 filter still covers 172 economies
Restricting the data to 2024 and 2025 leaves 172 countries and territories. Hong Kong SAR remains highest at 196.89%, followed by Luxembourg at 159.36% and Singapore at 142.45%. Lesotho and Naoero are also above 100%. San Marino drops out because its latest value is from 2023.
| Recent-data rank | Country or territory | Year | Imports/GDP |
|---|---|---|---|
| 1 | Hong Kong SAR, China | 2025 | 196.89% |
| 2 | Luxembourg | 2025 | 159.36% |
| 3 | Singapore | 2025 | 142.45% |
| 4 | Lesotho | 2025 | 104.45% |
| 5 | Naoero | 2025 | 103.68% |
| 6 | Malta | 2025 | 99.90% |
| 7 | Ireland | 2025 | 99.89% |
| 8 | Somalia, Fed. Rep. | 2025 | 98.81% |
| 9 | Kiribati | 2024 | 97.59% |
| 10 | Djibouti | 2025 | 95.80% |
| 11 | Seychelles | 2025 | 92.67% |
| 12 | Viet Nam | 2025 | 92.09% |
The full 194-economy view is useful when broad coverage is the priority. The 172-economy 2024–2025 subset provides much tighter temporal comparability. These should be presented as complementary views rather than merged into one undifferentiated ranking.
Small open economies often appear near the top
The upper part of the distribution includes Hong Kong SAR, Luxembourg, Singapore, Malta, and Ireland, along with smaller economies such as Lesotho, Naoero, Djibouti, and Seychelles. The map identifies that pattern, but the indicator alone cannot assign one cause to every high-ratio economy.
Imports can include consumer goods, capital goods, intermediate inputs, and services. In some economies, imported inputs support production that is later exported. A high ratio therefore should not be simplified into a claim that domestic production is weak. Exports, the current account, and sector-level production are needed for a fuller picture.
Large economies can have low ratios despite very large import values
The United States and China are both near the low end of the ratio distribution at about 14.04% and 16.89%, respectively. That does not mean they import little in absolute terms. Their large GDP denominators make very large import flows look smaller as a share of domestic output.
This is why the ratio should not be used as a ranking of total import-market size. Absolute import values answer that question. Imports as a share of GDP are more useful for comparing the relative scale of external purchases against the size of each economy.
A rising import ratio is not automatically a negative signal
The ratio can rise because imports increase, GDP falls, or both move at different rates. Higher imports can reflect stronger demand, more capital-goods purchases, or greater use of imported intermediate inputs. The economic meaning depends on what is being imported and what is happening to exports and domestic output.
For the same reason, this ratio alone cannot establish worsening trade balance, declining competitiveness, or vulnerability. Export-to-GDP ratios, current-account balances, foreign reserves, and sector data may all be needed depending on the question.
Ratios above 100% are consistent with national accounting
GDP measures domestic value added, while imports measure gross transactions from abroad. Imported intermediate goods can be processed domestically and incorporated into exports, and goods can pass through trading hubs. Because the numerator and denominator are not the same accounting concept, imports can exceed GDP.
A ratio below 100% is not automatically low dependence either. Energy, food, critical inputs, or business services can be economically important even when the aggregate ratio is modest. Product- and service-level trade data are required to identify specific dependencies.
The country mean is not a GDP-weighted world ratio
The 49.89% simple mean gives every economy equal weight. A very large economy and a small island economy each count once. It therefore cannot be interpreted as total world imports divided by total world GDP.
A global weighted ratio would need country GDP values as weights or, equivalently, aggregate imports divided by aggregate GDP. The median also describes the distribution of economies rather than the middle dollar of world output.
Source and calculation notes
The source is World Bank World Development Indicators series NE.IMP.GNFS.ZS. The analysis uses the latest non-empty observation for 194 countries and territories and calculates the mean, median, quartiles, distribution bands, and rankings directly from those values. The official World Bank API provides the series.
The map joins all 194 country codes to country centroids, producing a 100% match for the reported observations. Larger points mark 2024–2025 observations and smaller points mark 2023 or earlier. Missing economies are left as no data rather than converted to zero, and older latest observations retain their actual year.
Frequently Asked Questions
Can imports exceed 100% of GDP?
Yes. GDP measures domestic value added while imports measure gross purchases from abroad, so highly open or re-export-oriented economies can exceed 100%.
Is this a complete 2025 global ranking?
No. Of 194 latest observations, 138 are from 2025 and 34 from 2024, while several are older.
Does a high import-to-GDP ratio mean an economy is performing poorly?
Not necessarily. Capital goods, intermediate inputs, supply-chain structure, GDP size, and changes in domestic output can all affect the ratio.
Related Articles
Green Map creates custom-edited map images using open geographic data sources such as geoBoundaries, Natural Earth, OpenStreetMap, and government open data. These maps are edited visual materials, not raw data files, and are provided for education, documents, presentations, and graphic reference.