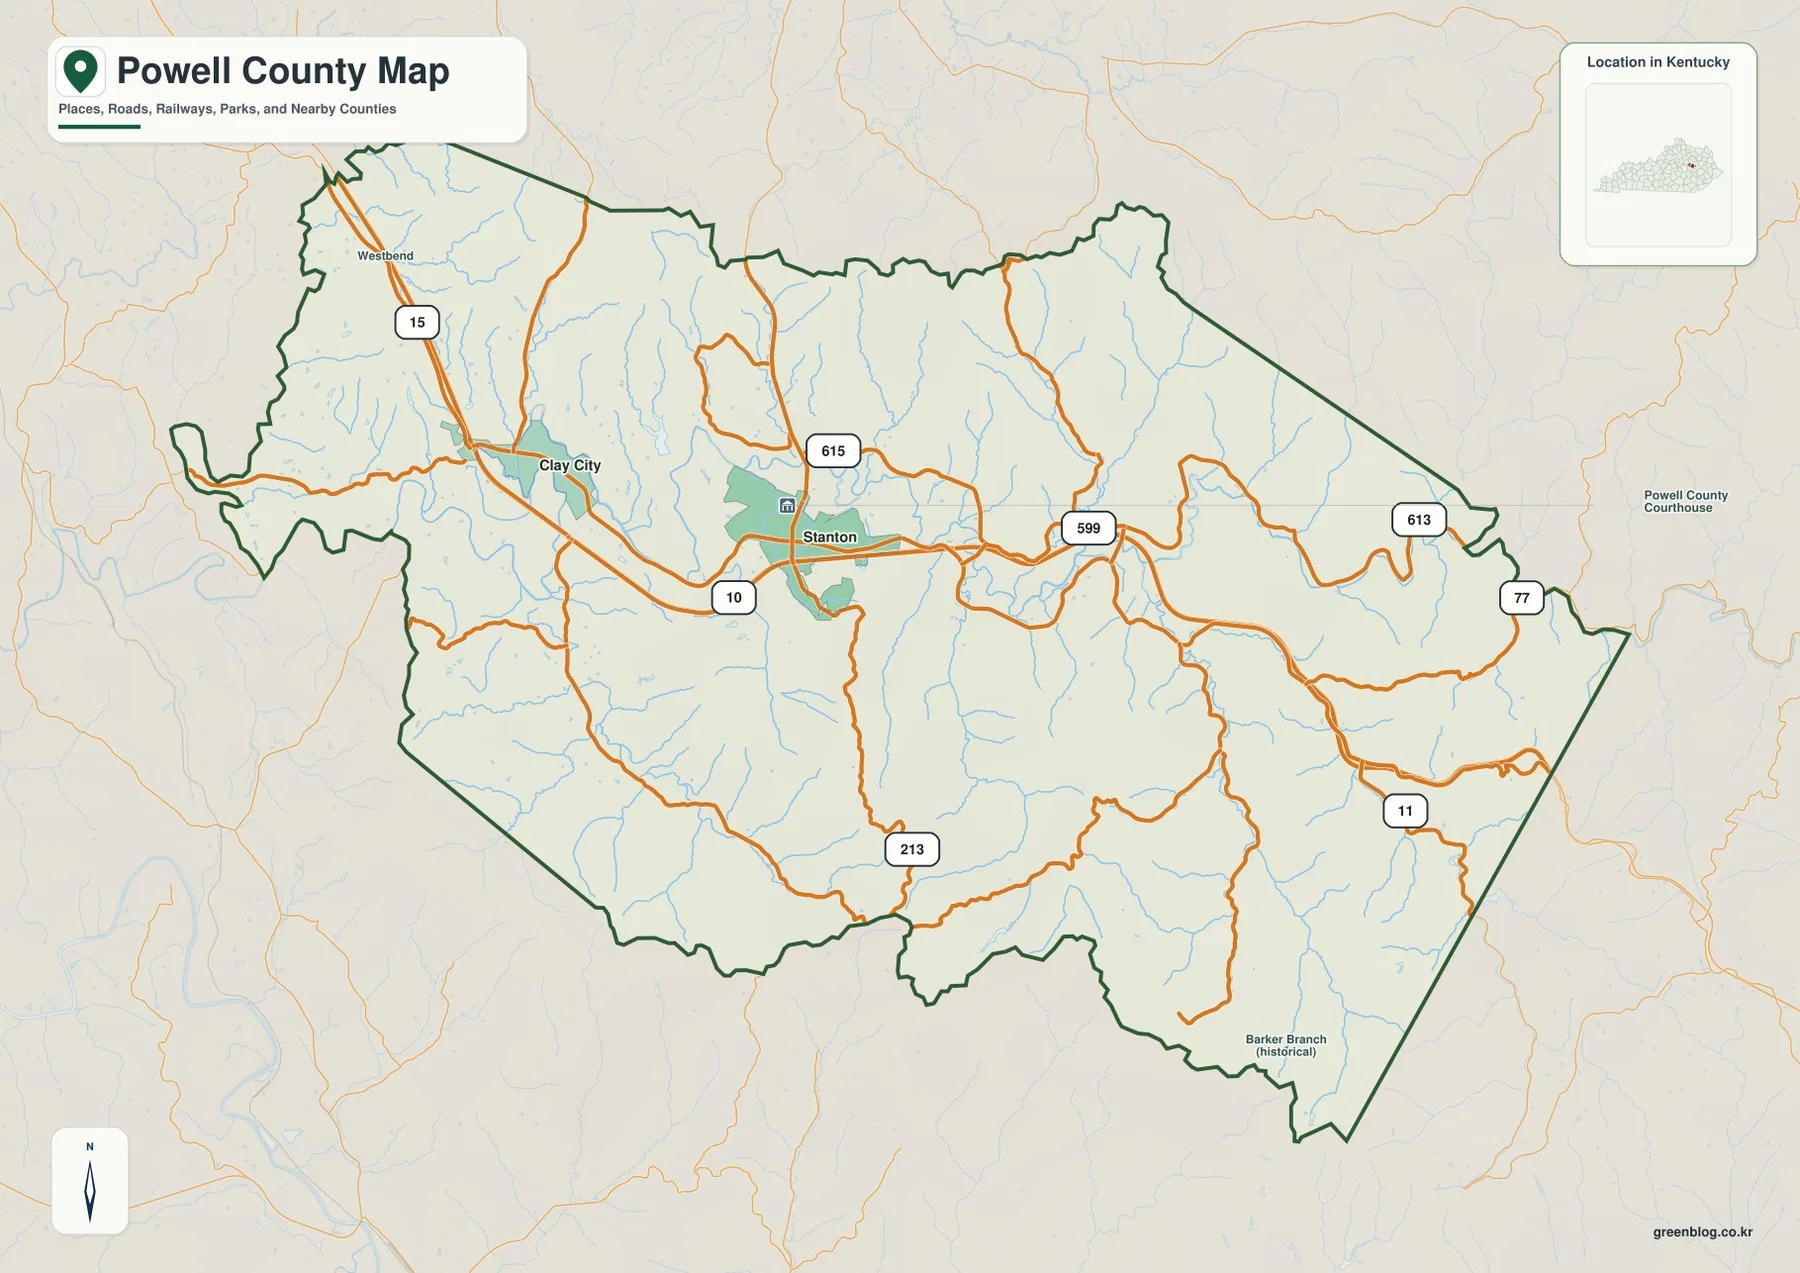
Powell County lies at the foothills of eastern Kentucky’s Appalachian Mountains, with Stanton and Clay City forming the clearest settlement pair. Routes 15, 10, 11, 213, 599, 613, 615, and 77 connect the central Red River corridor with more rugged northern and eastern terrain. The water map adds the Red River, Middle Fork Red River, South Fork Red River, Blair Branch, Black Creek, Hardwick Creek, Cat Creek, and many smaller tributaries. High-resolution JPG versions of the supplied maps can also be downloaded together in one ZIP archive for printing, classroom work, presentations, or offline reference. High-resolution map files are available for download in the section below.
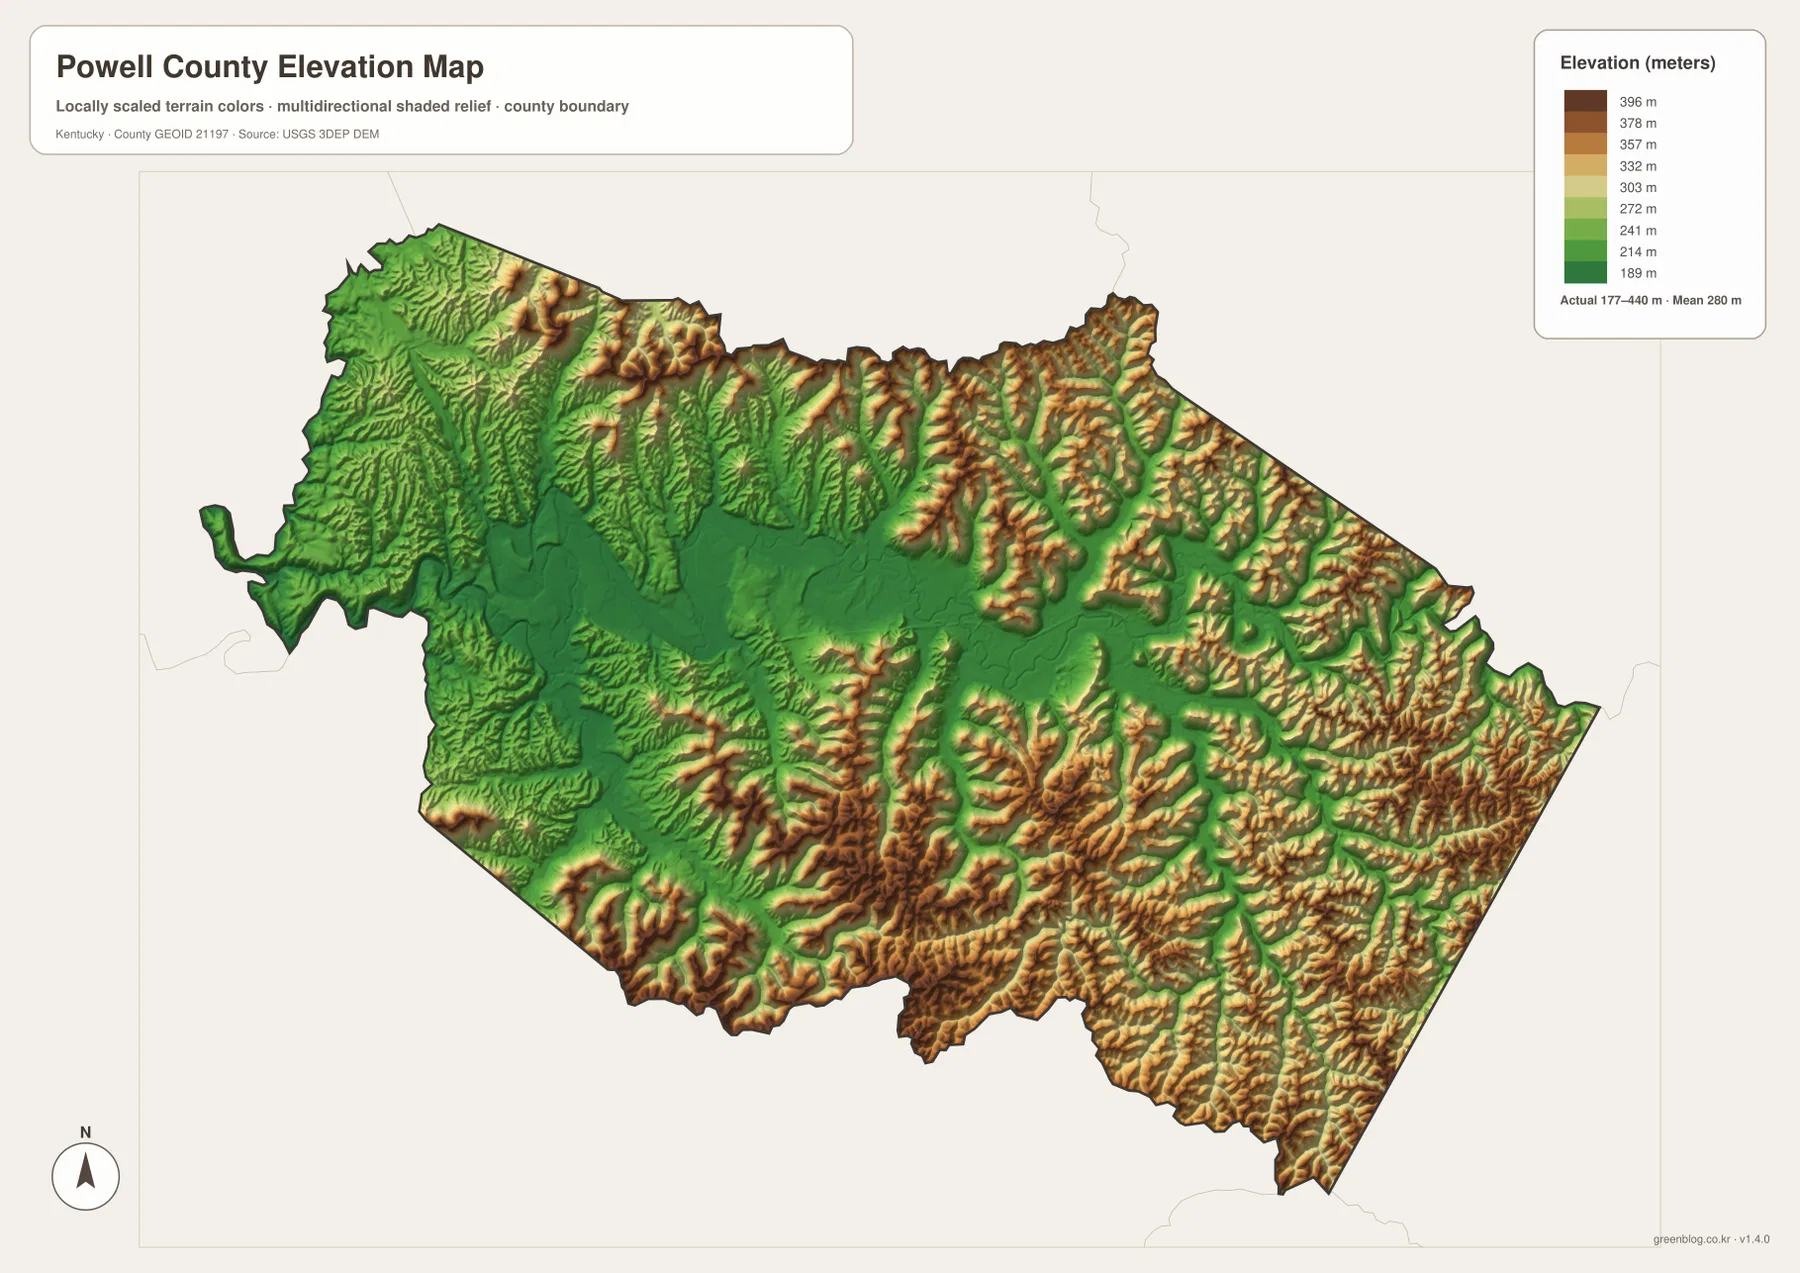
Kentucky.gov describes Powell County as a community in the foothills of the Eastern Appalachian Mountains and highlights Red River Gorge, Natural Bridge, and the towns of Clay City and Stanton. The official City of Stanton website identifies Stanton as the Powell County seat. The supplied elevation map reports an actual county range of about 177 to 440 meters with a mean near 280 meters, showing a lower central river corridor surrounded by much higher ridge country.
Table of Contents
Stanton and Clay City sit along the county’s main road corridor
The general county map makes Stanton and Clay City the easiest places to begin. Route 15 approaches from the northwest and passes Clay City before reaching the Stanton side, while route 10 follows the central corridor south of the two towns. Routes 615 and 599 branch around Stanton, and routes 613, 77, and 11 continue into the eastern hills.
Clay City sits close to the western Red River valley, while Stanton occupies the more central position where several routes converge. Westbend provides a northwestern reference along route 15, and Barker Branch appears as a historical-place label in the southeast. The road density around Stanton and Clay City is noticeably greater than in the outer mountain sections.
Route 213 crosses the southern interior, while routes 11 and 77 help orient the eastern side toward Wolfe County. The north and east contain fewer major settlement labels and many more small streams and winding local roads. Regional labels beyond the county make it easier to place Powell County between the Bluegrass and the Appalachian uplands.
This map is intended for geographic orientation rather than live navigation. It does not show current construction, temporary closures, bridge restrictions, or travel times. Roads often bend along creek valleys and around ridge systems, so actual driving distance can be much longer than the direct separation between two places.
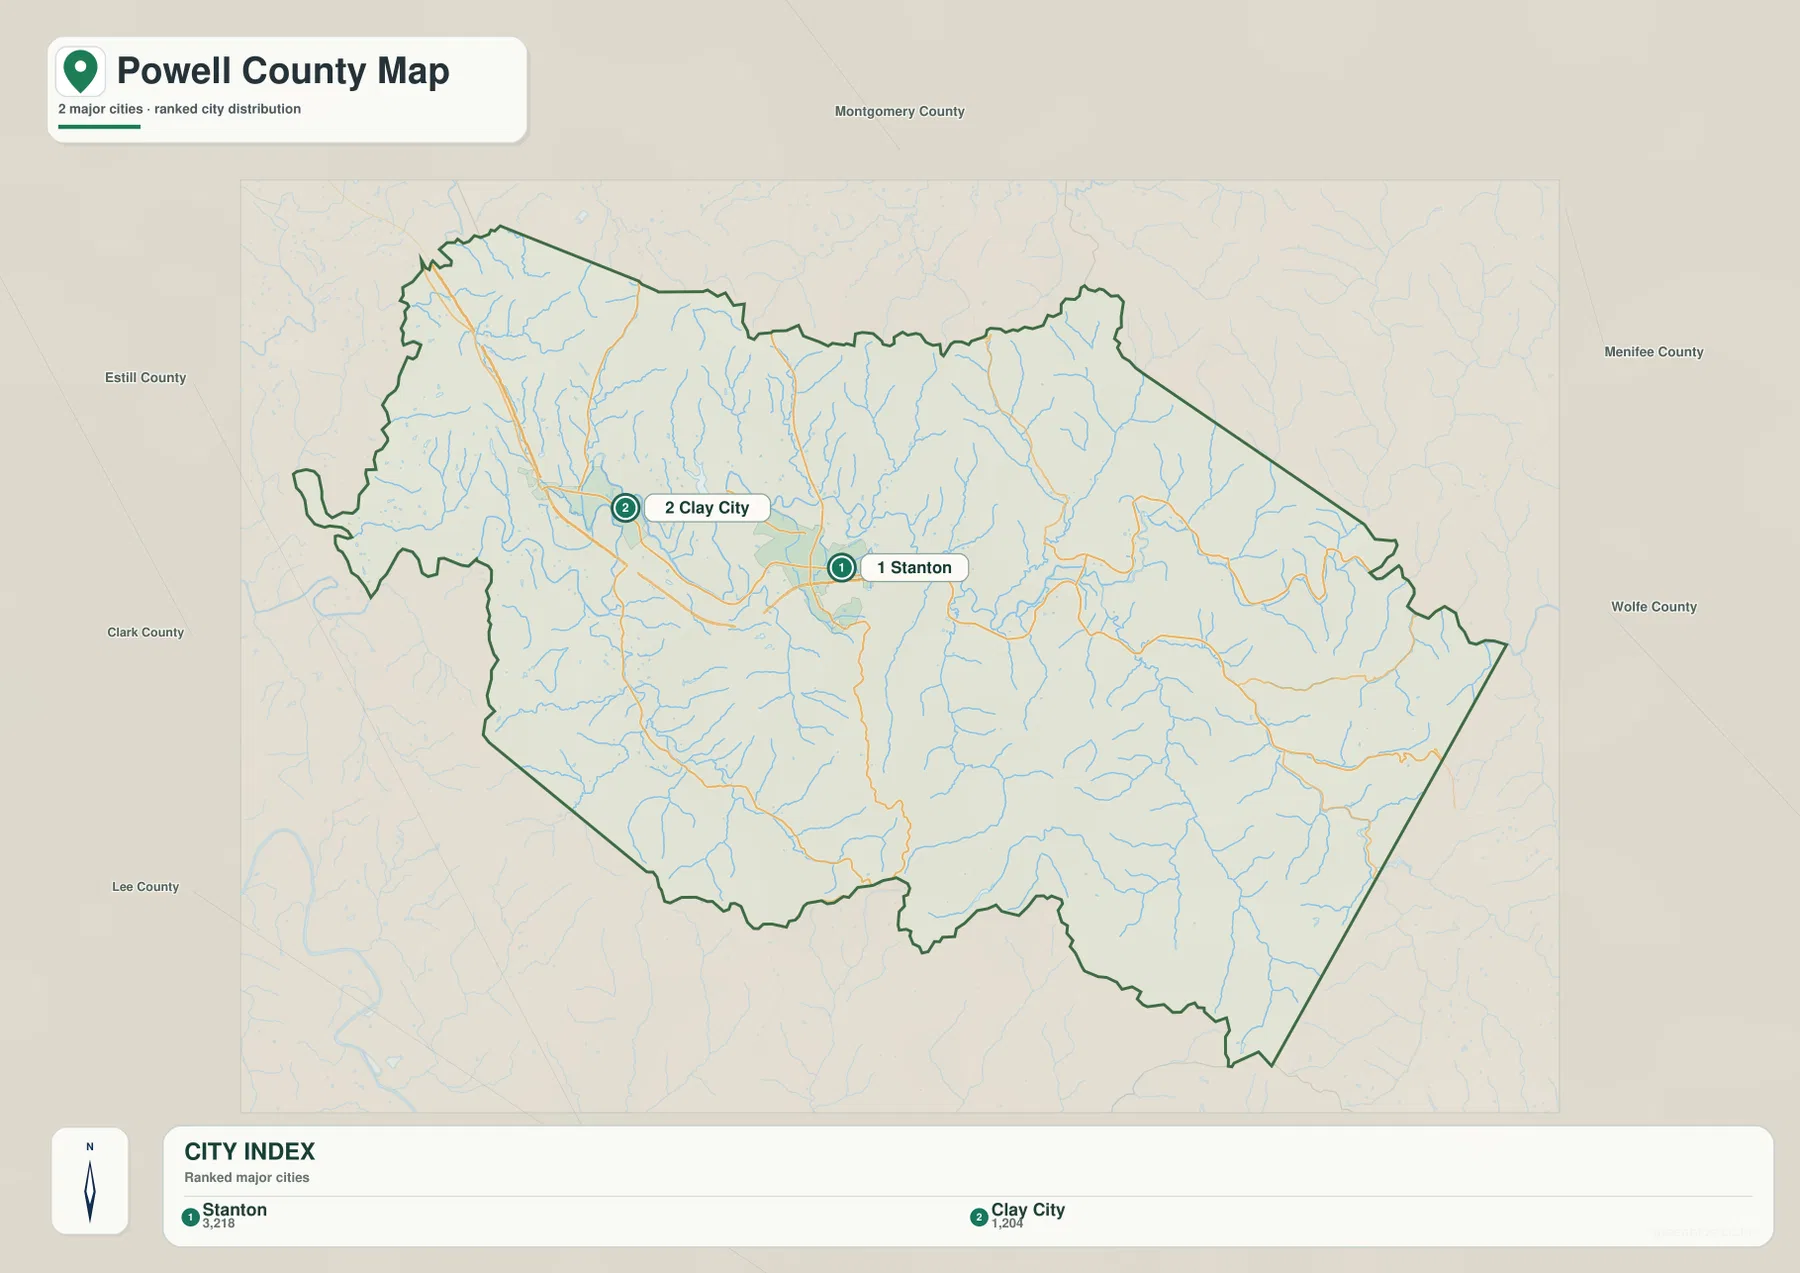
Stanton and Clay City form the two-city distribution
The city-distribution map ranks two major cities. Stanton is listed first with 3,218 residents and Clay City second with 1,204. These are the figures printed on the supplied map and are best used to compare the relative scale of the mapped settlements rather than assumed to be a current official population estimate.
Stanton occupies the central part of the county and Clay City lies to the west, giving the two towns a close geographic relationship along the main road and river corridor. The eastern half of the county contains no comparable city marker, which makes the contrast between the developed central-western area and the surrounding ridge country especially clear.
Neighboring county labels include Montgomery to the north, Menifee to the northeast, Wolfe to the east, Lee to the southwest, and Estill and Clark to the west and northwest. Those references place Powell County at the transition between Kentucky’s Bluegrass side and the more strongly dissected eastern uplands.
The simplified city view works well when settlement size and direction matter more than road detail. The general county map is better for route numbers, Westbend, Barker Branch, and local connections. Once Stanton and Clay City are fixed on the city map, the Red River and the elevation pattern become much easier to understand on the physical maps.
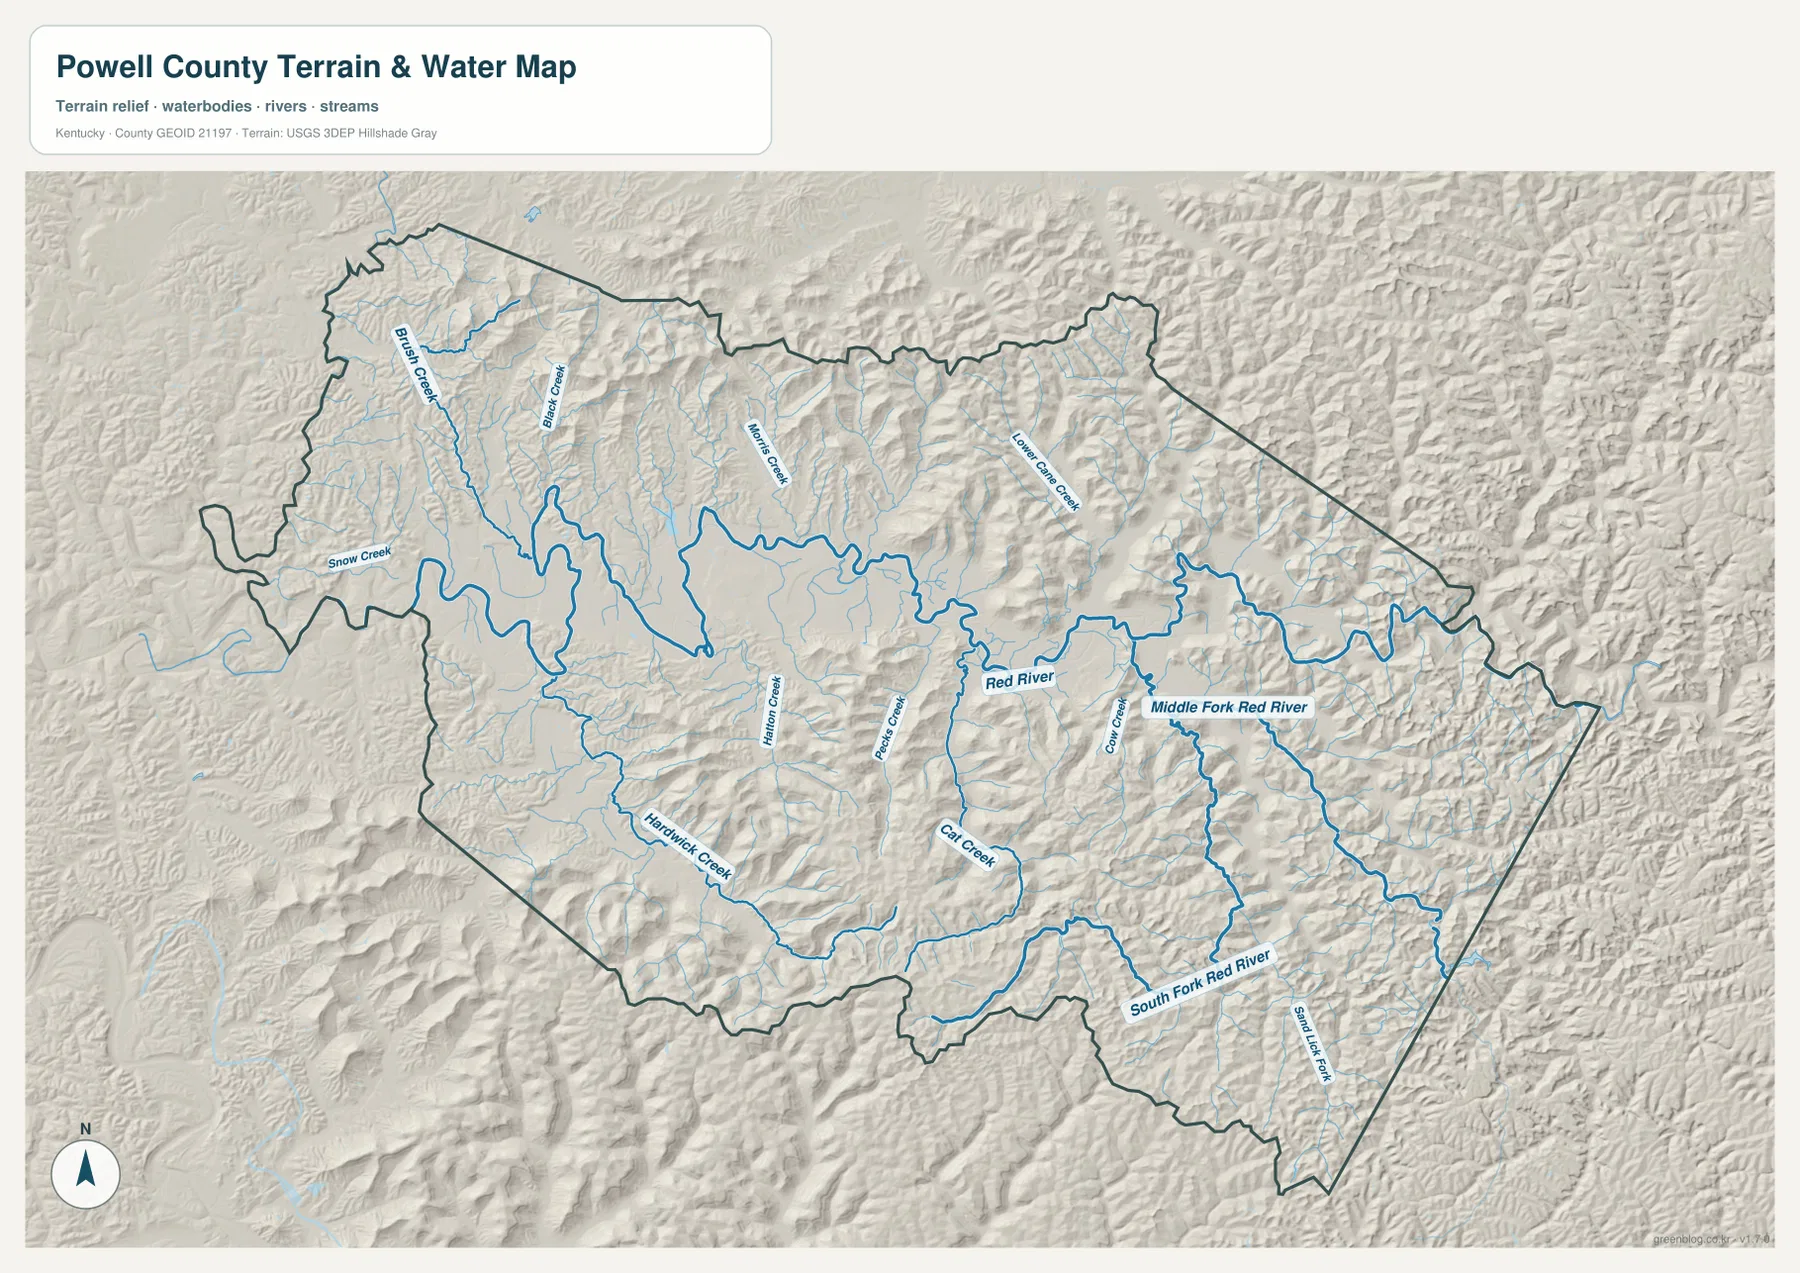
Red River creates the main low corridor through Powell County
The Red River is the dominant water feature on the terrain-and-water map, winding across the central county from west to east. It occupies a broader low valley than most of the tributaries and provides the clearest physical link between the Clay City-Stanton side and the more rugged eastern interior. The road and settlement pattern closely follows this lower corridor.
Blair Branch and Black Creek are prominent in the northwest, while Snow Creek appears closer to the western boundary. Middle Creek drains toward the central river from the north, and Lower Cane Creek occupies another long valley farther east. The close spacing of these tributaries shows how strongly the northern hills are divided by narrow stream bottoms.
South of the Red River, Hatcher Creek and Pierce Creek cross the central hills, and Hardwick Creek provides a strong southwestern reference. Cat Creek appears farther east, while the Middle Fork Red River and South Fork Red River occupy long valleys in the eastern and southeastern interior. These tributaries help explain why the surrounding ridge pattern is so complex.
A practical reading order is to start with the Red River, then move to Blair Branch and Black Creek in the northwest, Hatcher and Pierce creeks in the center-south, and finally the Middle Fork and South Fork Red River toward the east. This is a general geographic reference rather than a flood, navigation, water-depth, fishing-regulation, or property-access product. Current conditions should be checked with the responsible agencies.
Elevation from 177 to 440 meters rises sharply away from the river corridor
The elevation map reports an actual county range of about 177 to 440 meters and a mean near 280 meters. The lowest green terrain follows the Red River and major tributary valleys through the center and west. Higher yellow, orange, and brown ridges become widespread in the north, east, and south.
Stanton and Clay City lie within the broader lower terrain associated with the Red River corridor. Routes 15 and 10 also use that lower passage before the landscape rises more sharply toward the outer county. In the northern interior, elevation changes quickly across short distances because stream valleys cut deeply between the ridges.
The eastern and southeastern sections contain the strongest ridge relief. Middle Fork Red River and South Fork Red River remain in low green valleys, while the surrounding slopes rise into the darker elevation colors. Hardwick Creek creates a similar lower corridor in the southwest, but broad flat ground is still limited.
The elevation surface is intended for county-scale comparison rather than parcel-level measurement. It is useful for distinguishing river and creek valleys from high ridges, but it should not be treated as survey-grade elevation for a road, structure, property, or engineering project. Exact site work should rely on current source elevation data or professional surveying.
Following Powell County from Stanton to the Red River and eastern ridges
Stanton is the simplest starting point for comparing all of the map views. On the road map, locate routes 15, 10, 615, and 599, then identify Clay City to the west and routes 613 and 77 toward the east. On the physical map, the Red River provides the main corridor tying those areas together.
For the west, use Clay City and route 15 before tracing Blair Branch, Black Creek, and Snow Creek. The elevation surface shows relatively low terrain around the central-western river corridor, with higher ridges rising quickly to the north. This makes the Stanton-Clay City side the easiest place to understand the county’s road-water relationship.
For the east and south, use routes 11, 77, and 213 together with the Middle Fork Red River, South Fork Red River, Cat Creek, and Hardwick Creek. The elevation map shows that only the stream bottoms remain low while long ridges occupy most of the surrounding land. Comparing the same places across all three views makes Powell County’s Appalachian foothill terrain much easier to understand.
Choosing the best Powell County map for print, class, or reference
Use the general county map when Stanton, Clay City, numbered roads, smaller place labels, and the full boundary need to appear together. The city-distribution map is cleaner when the main question is how the two towns compare in relative size and where they sit within the county.
Choose the terrain-and-water map for the Red River, Middle Fork Red River, South Fork Red River, Blair Branch, Black Creek, Hardwick Creek, and Cat Creek. The elevation map is the strongest view for explaining the contrast between the low central river corridor and the higher eastern and southern ridges. Comparing water and elevation together makes that relationship especially clear.
The WebP images in the article are optimized for browser viewing. The downloadable ZIP contains the original JPG maps at 3,638×2,572 pixels each, which is better suited to printing, classroom worksheets, presentations, and offline reference. These maps are general geographic resources rather than legal boundary records, flood studies, parcel surveys, navigation products, or engineering plans.
Frequently Asked Questions
Is Stanton or Clay City the county seat?
Stanton is the county seat. The official City of Stanton Planning and Zoning page identifies Stanton as the seat of Powell County. On the supplied city map, Stanton is also the larger of the two ranked cities, with Clay City positioned to the west along the same central corridor.
Which maps best show the Red River and the eastern ridge terrain together?
Use the terrain-and-water map together with the elevation map. The first view shows the Red River, Middle Fork Red River, South Fork Red River, and major creeks, while the elevation map shows how those low valleys are enclosed by higher eastern and southern ridges.
Can the 177–440 meter elevation range be used as an exact property elevation?
No. The range summarizes the actual countywide elevations shown on the supplied map, with a mean near 280 meters. It is useful for comparing river valleys with high ridges, but exact site elevations should come from current source data or professional surveying.
Map File Information
The ZIP archive contains the original high-resolution JPG versions of the Powell County road-and-boundary map, city-distribution map, terrain-and-water map, and elevation map. Each image is 3,638×2,572 pixels for printing, classroom work, presentations, and offline reference.
- File Type: 4 JPG files inside one ZIP archive
Related Maps
Sources and references
County and Stanton information is available from the Kentucky.gov Powell County profile and the official City of Stanton Planning and Zoning page. For underlying geographic data, see the U.S. Census Bureau TIGER/Line Shapefiles for boundaries and roads, USGS National Hydrography for rivers and streams, and the USGS 3D Elevation Program for elevation data.
These maps are intended for geographic explanation, printing, and general reference. Legal boundary decisions, live traffic, flood and water-safety questions, property surveying, and engineering work should rely on the latest authoritative information from the responsible public agency.
Green Map creates custom-edited map images using open geographic data sources such as geoBoundaries, Natural Earth, OpenStreetMap, and government open data. These maps are edited visual materials, not raw data files, and are provided for education, documents, presentations, and graphic reference.