UNESCO Institute for Statistics (UIS) modelled estimates for 2025 show a very uneven global pattern in the share of primary-school-age children who are out of school. Across 195 countries and territories with a value, the median is 4.9% and the mean is 10.0%. Equatorial Guinea has the highest estimate at 62.0%, followed by South Sudan at 59.0% and Afghanistan at 52.7%. At the other end, 100 countries and territories are below 5%.
The indicator is explicitly labelled as modelled data. It estimates the percentage of children of official primary-school age who are out of school, rather than presenting a simple administrative headcount taken on one date. The modelling makes broad cross-country comparison possible when reporting years and data coverage differ, but it also means that tiny differences between countries should not be treated as perfectly precise rankings.
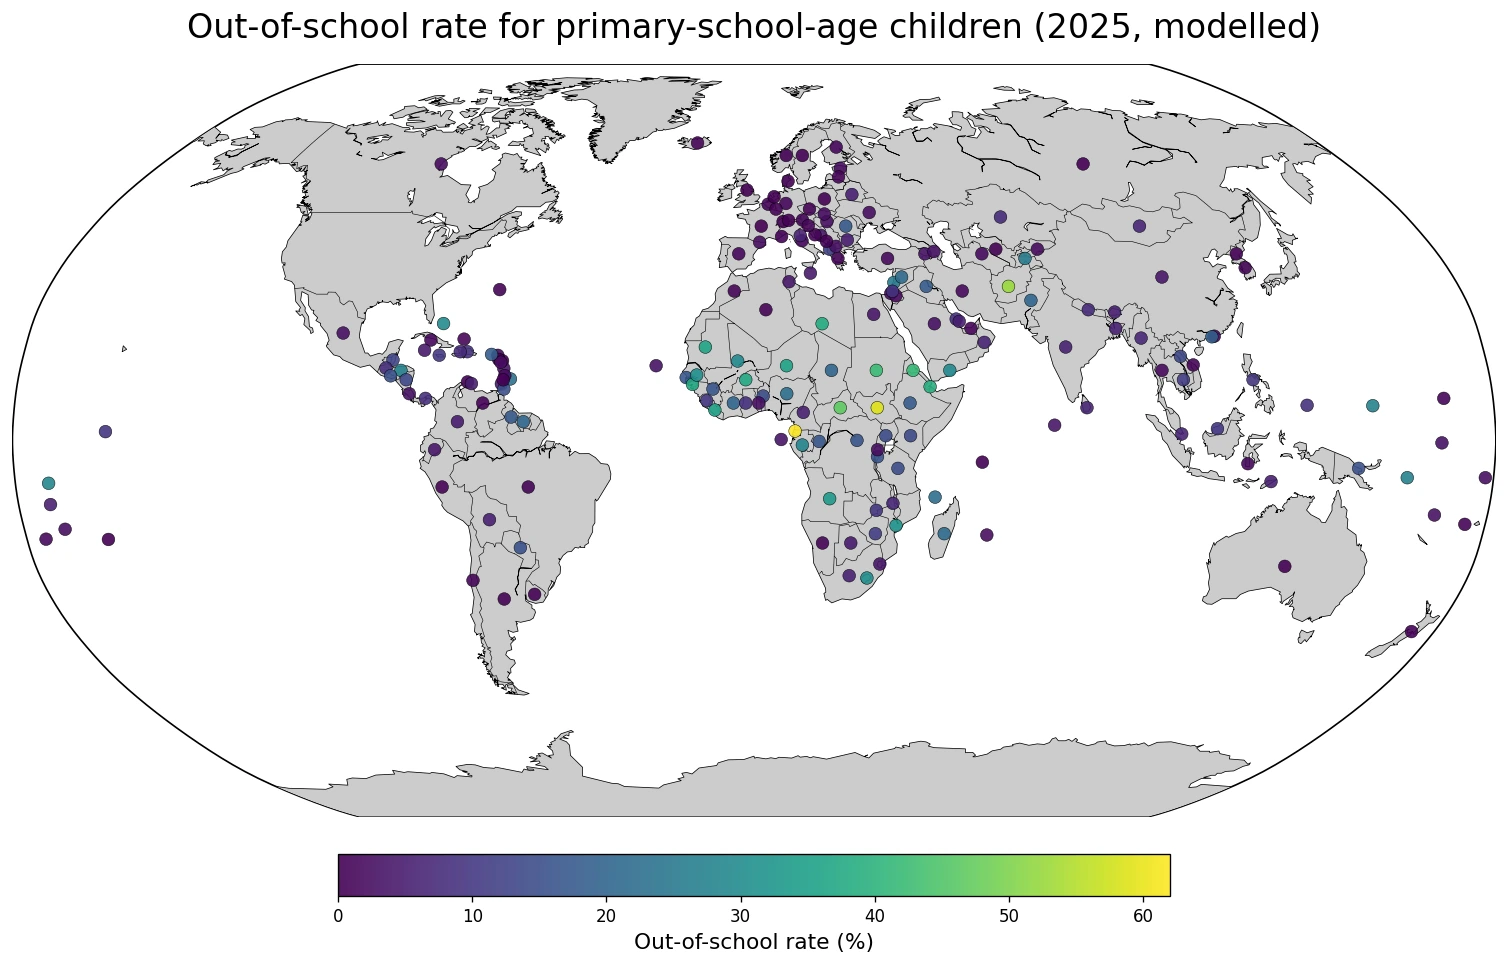
Table of Contents
Only three countries are above 50%
Equatorial Guinea is highest at 62.0%, South Sudan is at 59.0%, and Afghanistan is at 52.7%. These are the only three observations above the halfway mark. Central African Republic follows at 46.6%, Sudan at 42.3%, Eritrea at 41.8%, Djibouti at 39.2%, and Libya at 37.8%.
There are 27 observations at or above 25% and 17 at or above 30%. Many of the highest estimates are in Sub-Saharan Africa, the Sahel, and the Horn of Africa, but Afghanistan is a major high-rate case outside those regions. The pattern is geographically concentrated without being confined to a single region.
| High-rate order | Country or territory | Out-of-school rate |
|---|---|---|
| 1 | Equatorial Guinea | 62.0% |
| 2 | South Sudan | 59.0% |
| 3 | Afghanistan | 52.7% |
| 4 | Central African Republic | 46.6% |
| 5 | Sudan | 42.3% |
| 6 | Eritrea | 41.8% |
| 7 | Djibouti | 39.2% |
| 8 | Libya | 37.8% |
| 9 | Guinea-Bissau | 37.1% |
| 10 | Burkina Faso | 36.9% |
| 11 | Mauritania | 35.9% |
| 12 | Niger | 35.7% |
| 13 | Liberia | 35.5% |
| 14 | Angola | 33.0% |
| 15 | Mozambique | 31.9% |
More than half of the observations are below 5%
The median of 4.9% means that half of the observations are at or below roughly five percent. In fact, 100 of the 195 countries and territories are below 5%, equal to 51.3% of the dataset. Another 32 fall between 5% and 9.9%, 36 are between 10% and 24.9%, and 24 are between 25% and 49.9%.
| Out-of-school-rate band | Countries or territories | Share of observations |
|---|---|---|
| Below 5% | 100 | 51.3% |
| 5–9.9% | 32 | 16.4% |
| 10–24.9% | 36 | 18.5% |
| 25–49.9% | 24 | 12.3% |
| 50% or more | 3 | 1.5% |
The middle half of the estimates stretches from 1.3% to 15.4%. Most observations are therefore in the low or moderate range, while a relatively small group extends into the 30% to 60% range. That long upper tail explains why the mean of 10.0% is more than twice the median of 4.9%.
Very low estimates should not be read as exact zero exclusion
The minimum published estimate is 0.1%, and several countries and territories are at that level, including Aruba, Antigua and Barbuda, Australia, Switzerland, the Cook Islands, France, Saint Kitts and Nevis, Montenegro, the Netherlands, the Russian Federation, and Saint Vincent and the Grenadines. The United Kingdom, Liechtenstein, Poland, and Sweden are among the observations around 0.2%.
| Low-rate order | Country or territory | Out-of-school rate |
|---|---|---|
| 1 | Aruba | 0.1% |
| 2 | Antigua and Barbuda | 0.1% |
| 3 | Australia | 0.1% |
| 4 | Switzerland | 0.1% |
| 5 | Cook Islands | 0.1% |
| 6 | France | 0.1% |
| 7 | Montenegro | 0.1% |
| 8 | Saint Kitts and Nevis | 0.1% |
| 9 | Russian Federation | 0.1% |
| 10 | Saint Vincent and the Grenadines | 0.1% |
| 11 | Netherlands | 0.1% |
| 12 | United Kingdom of Great Britain and Northern Ireland | 0.2% |
| 13 | Poland | 0.2% |
| 14 | Liechtenstein | 0.2% |
| 15 | Seychelles | 0.2% |
Because these are modelled estimates, a difference between 0.1% and 0.2% should not be interpreted as a meaningful ranking of education-system quality. At very low levels, small variations in population estimates, administrative reporting, or model adjustment can be noticeable in percentage terms. The strongest cross-country signals in this dataset are the much larger gaps between low-single-digit estimates and the countries above 30% or 50%.
High rates are concentrated in several African regions, with important exceptions
Many of the estimates above 30% are in Africa: Equatorial Guinea, South Sudan, Central African Republic, Sudan, Eritrea, Djibouti, Guinea-Bissau, Burkina Faso, Mauritania, Niger, Liberia, Angola, and Mozambique all appear near the upper end. Libya is also high at 37.8%. On the map, this produces a visible concentration across parts of Central, West, East, and North Africa.
Geography alone does not identify the cause. Conflict, displacement, household income, school availability, distance, gender inequality, disability, rural access, and data-system limitations can all affect whether children are in school. This indicator measures the national out-of-school rate; it does not assign a causal explanation to any country’s value.
Afghanistan’s 52.7% estimate is an important reminder that very high rates are not exclusive to Africa. Likewise, there are African countries with much lower estimates, so continental averages should not be used as substitutes for country-level evidence. The map is best used to identify where the gaps are largest and where more detailed country-specific evidence is needed.
A modelled estimate is different from a direct headcount
UIS labels this series as modelled data because it uses statistical estimation to improve comparability and fill gaps that arise when countries report in different years or have incomplete observations. That approach is especially useful for a global map, where relying only on same-year direct observations would leave many countries missing. However, a modelled national percentage is not a substitute for an exact count of children currently out of school in a particular district or community.
Uncertainty may be larger where population estimates are difficult, administrative registration is incomplete, or migration, refugee movements, and displacement are substantial. A modelled estimate of 40% is therefore best understood as a standardized international estimate based on available evidence, not as a claim that exactly 40.0% of children were directly counted outside school.
Out-of-school rate is related to enrolment, but it is not interchangeable with every enrolment indicator
The out-of-school rate focuses on children of official primary-school age who are not in school. Net enrolment, gross enrolment, attendance, and completion indicators answer different questions and can use different numerators and denominators. Age-grade mismatch and movement between education levels mean that it is not always valid to subtract one enrolment indicator from 100 and assume the result is exactly this out-of-school measure.
National averages also hide internal inequality. A country with a national rate of 5% may have much higher exclusion in rural areas, among poorer households, among children with disabilities, or in conflict-affected regions. The country map is useful for identifying broad national gaps, while equity analysis requires disaggregated data.
Why the distribution is more informative than the mean
The arithmetic mean is 10.0%, but the median is only 4.9%. If the mean were used alone, it could suggest that a typical country has around one child in ten out of school. The actual distribution is quite different: more than half of the observations are below 5%, while a smaller set of countries with rates above 25%, 30%, and 50% pulls the average sharply upward.
The gap between the minimum of 0.1% and the maximum of 62.0% is more than 60 percentage points. That is not just a ranking difference; it represents a very large difference in basic access to schooling for children of primary-school age. The appropriate next step is not to infer causes from the map, but to use the map to identify high-rate countries and then examine additional education and social indicators.
Data scope and source
The analysis uses 195 national-level 2025 modelled estimates from the UNESCO Institute for Statistics official API indicator ROFST.MOD.1. The unit is percent and the indicator covers both sexes. Countries without an included 2025 observation are not assigned zero, and all averages, medians, bands, and rankings in this article are calculated directly from the supplied 195 observations.
The map plots one representative location for each country or territory. Point size does not represent the number of children or national population. The same 10% rate can correspond to very different numbers of out-of-school children in a large country and a small country, so percentage and absolute headcount are separate questions.
The main takeaway
The median out-of-school rate across the 195 observations is 4.9%. 100 countries and territories are below 5%, but 27 are at or above 25%, and Equatorial Guinea, South Sudan, and Afghanistan are above 50%. The global picture is therefore one of broad low-rate coverage alongside a smaller group facing very severe exclusion. Reading the map together with the distribution bands gives a much clearer picture than relying on the global mean alone.
Frequently Asked Questions
What does the out-of-school rate measure?
It measures the share of children of official primary-school age who are out of school. The 2025 values used here are UNESCO UIS modelled estimates.
Which countries have the highest 2025 estimates?
Among the 195 observations, Equatorial Guinea is highest at 62.0%, followed by South Sudan at 59.0% and Afghanistan at 52.7%.
Are modelled estimates the same as exact headcounts?
No. They are statistically modelled percentages designed for international comparison, not direct counts of children in every locality.
Related Maps
Green Map creates custom-edited map images using open geographic data sources such as geoBoundaries, Natural Earth, OpenStreetMap, and government open data.
These maps are edited visual materials, not raw data files, and are provided for education, documents, presentations, and graphic reference.