The gross graduation ratio from first-degree programmes is easy to mistake for a university completion rate. It is not. UNESCO Institute for Statistics (UIS) indicator GGR.6T7 compares the number of graduates from first-degree programmes at ISCED levels 6 and 7 with the population at the theoretical graduation age of the most common first-degree programme. The measure therefore describes the scale of first-degree output relative to a reference-age population rather than the share of a particular entering class that eventually graduates.
The 2023 country series associated with this indicator has 75 observations. That count is useful for understanding the available comparison set, but it does not mean that every country in the world reported a value under identical conditions. Missing data are not zero, reporting coverage can vary, and national degree structures are not perfectly interchangeable. Good comparisons therefore begin with the numerator, denominator, reference year and programme structure rather than with a ranking alone.
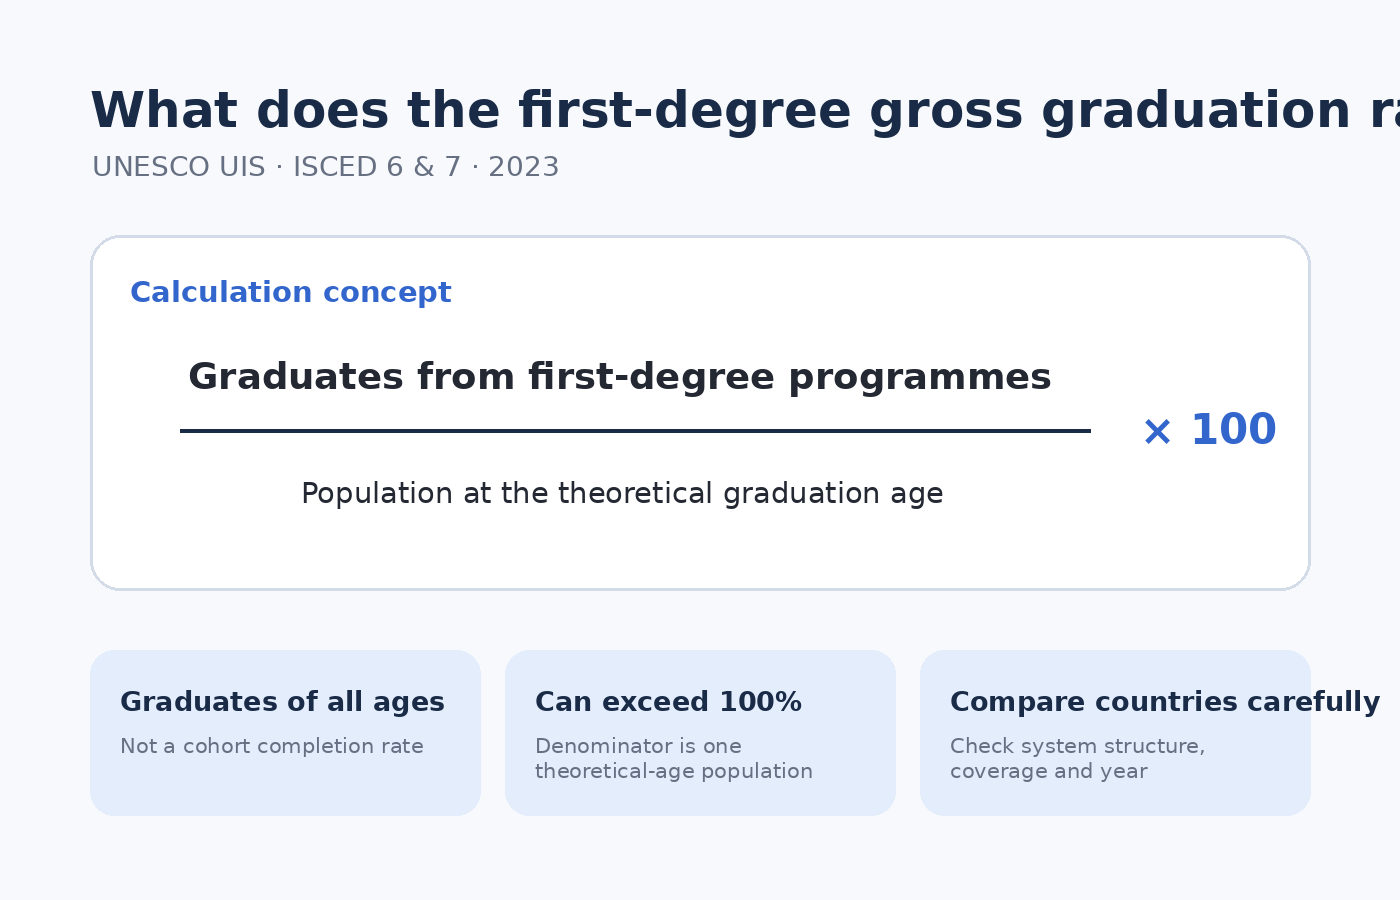
Table of Contents
The ratio is not the percentage of entrants who successfully graduate
Under the UIS definition, the numerator is the number of graduates from first-degree tertiary programmes at ISCED levels 6 and 7. The denominator is not the number of students who entered university several years earlier. It is the population at the theoretical graduation age of the most common first-degree programme in that country. The indicator is calculated by dividing graduates by that reference-age population and multiplying by 100.
A cohort completion rate asks a different question. It follows a defined group of students and measures how many complete their programme after a specified amount of time. GGR.6T7 does not track the same individuals from entry to graduation. It is better understood as an annual output measure: how large is the flow of first-degree graduates when compared with the population of the age at which students would normally finish the most common first degree?
ISCED 6 and 7 are included because first degrees are not structured the same way everywhere
ISCED is UNESCO’s framework for comparing education systems that use different national programme names. ISCED level 6 generally covers bachelor’s or equivalent programmes, while level 7 generally covers master’s or equivalent programmes. The important phrase in this indicator, however, is first-degree programmes. In many systems the first tertiary degree is awarded at level 6, but some long integrated professional programmes can lead to a first degree classified at level 7.
For that reason, relabelling the indicator simply as a “bachelor’s graduation rate” can exclude valid first-degree routes in some systems. Calling it the combined share of all bachelor’s and master’s graduates would also be misleading, because subsequent level-7 degrees are not the concept being measured. The international definition is designed to compare the first major degree outcome even when national programme structures differ.
The gross graduation ratio can exceed 100 percent
The word “percentage” often suggests a natural ceiling of 100, but UIS explicitly notes that this indicator can exceed 100%. The numerator includes graduates regardless of age. People can graduate earlier or later than the theoretical age, return to study after interruptions, move through different programme pathways, or complete qualifications under structures that do not line up neatly with one age cohort.
The denominator, meanwhile, is a single reference-age population. If a country produces first-degree graduates across several ages and that total is large relative to the population at the theoretical graduation age, the ratio can go above 100. Such a value does not mean that more than every person in an entering class graduated, because an entering class is not the denominator. Nor does it automatically indicate a data error.
A high ratio describes graduate output, not every dimension of higher-education quality
UIS interprets a high gross graduation ratio as evidence of substantial output from current first-degree programmes. It can therefore be useful for describing the scale at which a higher-education system produces first-degree graduates. It should not, however, be turned into a complete league table of educational quality or efficiency without additional evidence.
Programme length, adult participation, international student flows, demographic structure, private-institution coverage and the organization of vocational and academic routes can all affect the relationship between graduate counts and the reference-age population. The ratio says nothing by itself about learning outcomes, employment, wages, research quality, student debt, affordability or whether graduates work in fields related to their degree. Those questions require different datasets.
Enrolment, adult attainment and field-of-study shares use different denominators
Education statistics contain many percentages that look comparable at first glance. They are not interchangeable. The tertiary gross enrolment ratio compares enrolled students with a reference-age population. Adult educational attainment measures the share of an adult population, often age 25 and older, that has completed at least a given level. Field-of-study graduate shares use all tertiary graduates in a reference year as the denominator and ask how those graduates are distributed across subject areas.
| Indicator | Main denominator | Question answered |
|---|---|---|
| First-degree gross graduation ratio | Population at the theoretical graduation age | How large is first-degree graduate output relative to the reference-age population? |
| Tertiary gross enrolment ratio | Reference-age population for tertiary education | How large is current participation in tertiary education? |
| Adult educational attainment | Usually the population age 25+ | What share of adults has already completed at least a given level? |
| Graduate share by field | All tertiary graduates in the reference year | How are graduates distributed across fields of study? |
Two indicators can both show 50% and still describe completely different populations. Subtracting one from another or treating them as alternative versions of the same rate can produce a meaningless comparison. A reliable reading always starts by asking who is counted in the numerator, who is counted in the denominator, and which period the observation represents.
The 75 observations in 2023 define the reporting set, not a world average
The 2023 GGR.6T7 country series contains 75 observations. This tells us how many country-level values were available in the verified comparison set for that year. It does not automatically provide a population-weighted world average, and it does not justify assigning zero to countries with no reported value. A simple average across 75 country rows would give a small country the same weight as a very populous country.
The distinction also matters for maps. An unfilled country should be labelled as no data rather than placed in the zero-percent class. Rankings should state that they cover reporting countries only, and small decimal differences should not be interpreted as proof that one higher-education system is definitively better than another. Reporting practices and degree structures can matter as much as a small numerical gap.
Overall graduation output and gender parity are separate questions
GGR.6T7 combines both sexes. If the question is whether women’s and men’s graduation ratios are balanced, separate female and male series or an adjusted gender parity index (GPIA) is more appropriate. A country can have a high overall gross graduation ratio while still showing a gender gap. It can also have values close to gender parity at a relatively low overall level.
Keeping those concepts separate improves analysis. The overall gross graduation ratio describes the scale of first-degree output. Gender parity describes relative balance between female and male outcomes. Field-of-study indicators describe the composition of graduates. Adult attainment describes the accumulated educational stock in the population. None of these indicators can substitute for all the others.
Source and checks for cross-country comparisons
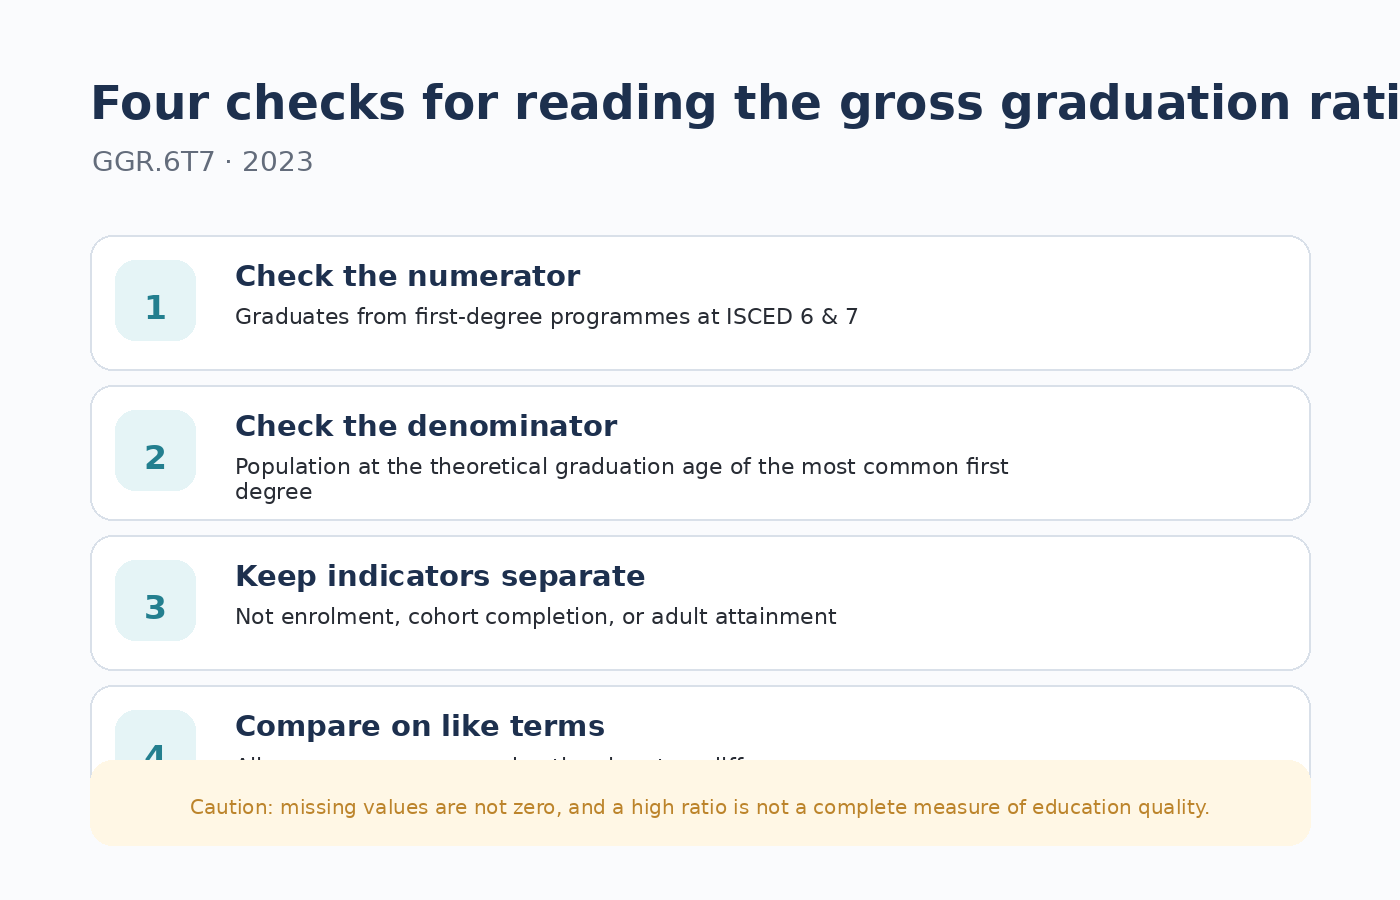
The indicator definition and methodology are documented by the UNESCO Institute for Statistics glossary entry for the gross graduation ratio from first-degree programmes. The World Bank Gender Data Portal also presents the corresponding tertiary gross graduation ratio series sourced from UNESCO UIS. Before comparing countries, check that observations refer to the same year, distinguish missing values from zeros, keep national programme structures in view, and avoid treating the ratio as a cohort completion rate or a complete score of educational quality.
Frequently Asked Questions
Is the first-degree gross graduation ratio the percentage of university entrants who graduate?
No. GGR.6T7 uses the population at the theoretical graduation age of the most common first-degree programme as its denominator, not a past entering cohort.
Why can the gross graduation ratio exceed 100%?
Graduates of different ages can be included in the numerator, while the denominator is one theoretical-age population. Graduate output can therefore be larger than that reference population.
Does ISCED 6 and 7 mean all bachelor and master graduates are added together?
No. The indicator covers first-degree programmes classified at ISCED 6 or 7. Some long integrated programmes may award a first degree at level 7, while subsequent level-7 degrees are a different concept.
What should be checked before ranking countries?
Use the same reference year, distinguish missing values from zeros, confirm consistent indicator definitions, and consider differences in national degree structures and reporting coverage.
Related Articles
- Education-Field Share Among Tertiary Graduates by Country
- Engineering, Manufacturing & Construction Share of Tertiary Graduates
- Natural Sciences, Mathematics & Statistics Share of Tertiary Graduates
Green Map creates custom-edited map images using open geographic data sources such as geoBoundaries, Natural Earth, OpenStreetMap, and government open data.
These maps are edited visual materials, not raw data files, and are provided for education, documents, presentations, and graphic reference.