Most reporting education systems keep lower secondary schooling overwhelmingly general rather than vocational. In the UNESCO Institute for Statistics (UIS) 2024 data, 85 of 120 countries and separately reported areas record a general-programme share of exactly 100%. Another 25 are between 95% and 100%, so 91.7% of all observations are at least 95%. The median is 100%. That concentration makes this less useful as a conventional ranking and more useful as a view of when education systems begin separating students into different programme orientations.
The official series is Share of all students in lower secondary education enrolled in general programmes, both sexes (%), indicator GTVP.2.GPV. Lower secondary corresponds to ISCED level 2. The numerator is enrolment in general programmes at that level, while the denominator is all enrolment at the same level across programme orientations. A value of 75% therefore means about three quarters of lower-secondary enrolment is in general programmes. It does not mean that 75% of all adolescents are enrolled in school.
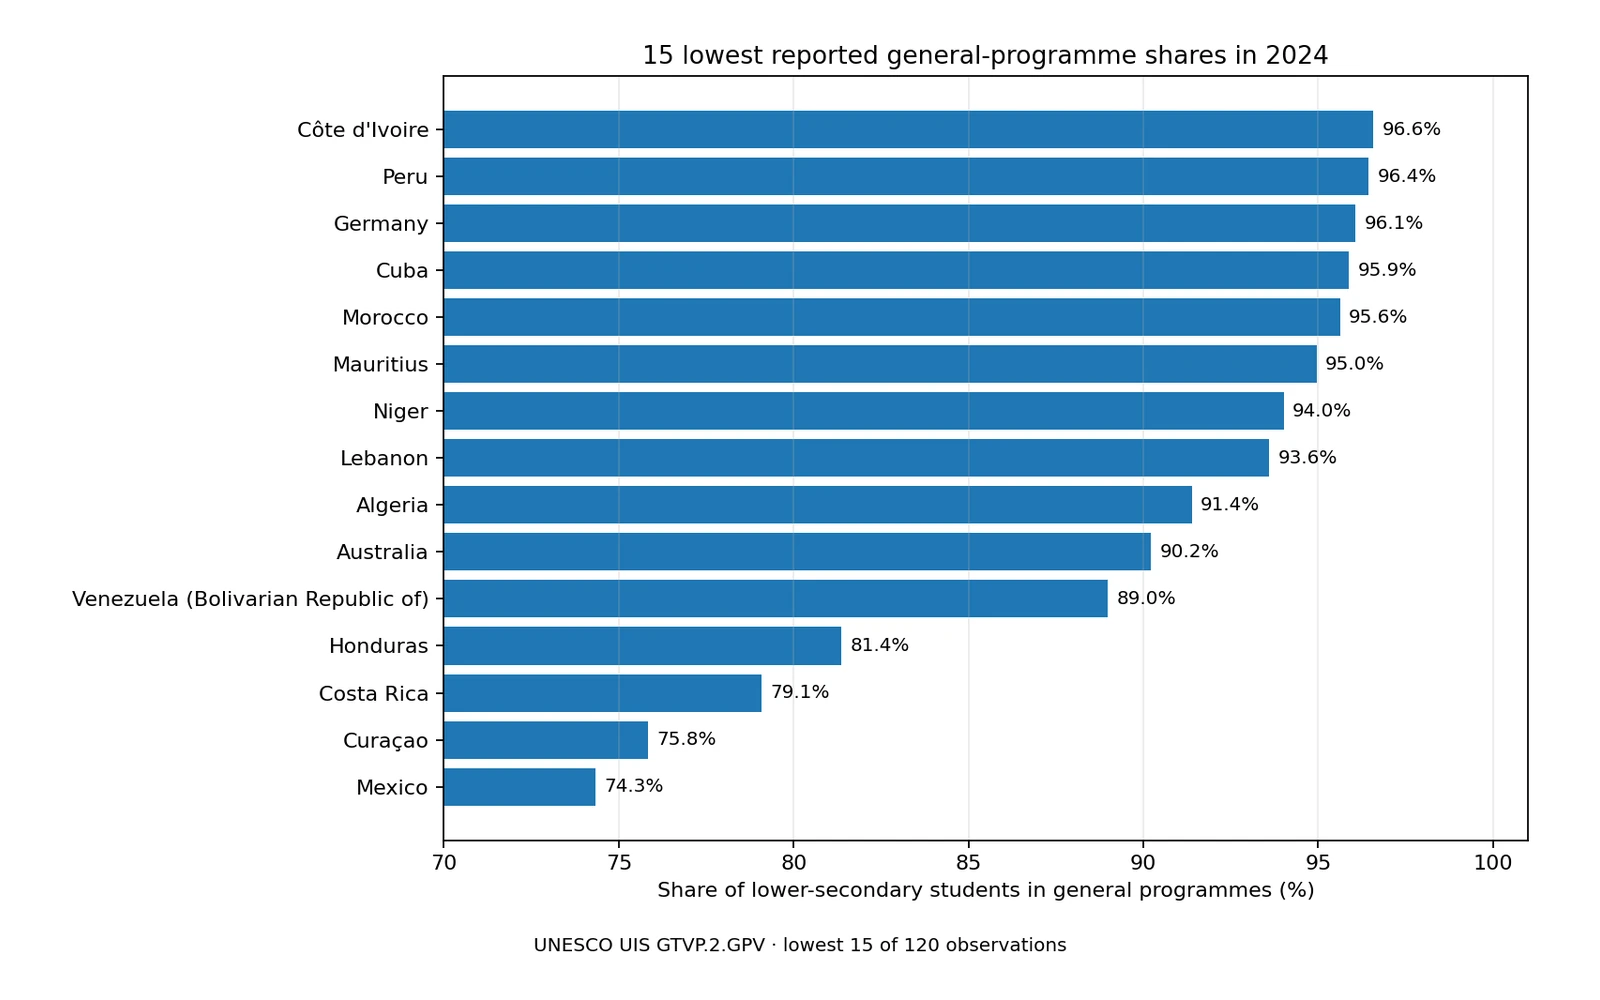
Table of Contents
What the general-programme share actually measures
UIS defines the programme-orientation percentage as the number of students enrolled in general or vocational/technical programmes at a given education level divided by total enrolment at that same level. GTVP.2.GPV selects the general orientation and ISCED 2. The percentages across orientations are expected to sum to 100 for the level. A reported value of 100% therefore means that all enrolment covered by the indicator is classified as general at lower secondary. A value of 80% leaves roughly 20% in other programme orientations under the same classification.
General education is designed to develop broad knowledge, skills, literacy and numeracy and typically prepares learners for more advanced study rather than a specific occupation. Vocational or technical programmes are more directly oriented toward occupational knowledge, skills and competencies. The distinction is internationally standardized, but national institutions do not all divide schooling at the same age or use the same school types. A general-programme percentage should therefore be read as a structural characteristic of an education system, not as the name of a particular national school category.
This distinction also explains why the indicator is not a quality score. A system that keeps everyone in a common general curriculum through lower secondary may postpone vocational specialization until upper secondary. Another system may introduce occupational pathways earlier. Neither arrangement is automatically associated with stronger reading scores, higher completion, better earnings or more successful school-to-work transitions. Those outcomes require separate evidence.
Seventy-one percent of the 120 observations are exactly 100%
Across the 120 observations, the unweighted mean is 98.49% and the median is 100%. The median sits above the mean because a small lower tail pulls the average down while most observations are clustered at the ceiling. There are 85 observations at exactly 100%, 110 at or above 95%, only 10 below 95%, 5 below 90%, and 3 below 80%.
| General-programme share in 2024 | Countries/areas | Share of 120 |
|---|---|---|
| 100% | 85 | 70.8% |
| 95% to <100% | 25 | 20.8% |
| 90% to <95% | 5 | 4.2% |
| 80% to <90% | 2 | 1.7% |
| Below 80% | 3 | 2.5% |
This ceiling-heavy distribution is why a list of “top countries” would add little information. Eighty-five places are tied at the maximum, and many more differ from 100 by less than a few percentage points. The meaningful contrast lies in the smaller group where a noticeable share of lower-secondary enrolment is classified outside the general orientation.
The 98.49% mean should not be described as the share of the world’s lower-secondary students in general programmes. Each country or separately reported area receives equal weight in this calculation regardless of enrolment size. A student-weighted global rate would require the actual lower-secondary enrolment count for every reporting unit. Here, the mean and median summarize the distribution of country-level structures only.
Mexico, Curaçao and Costa Rica have the lowest reported general shares
Mexico has the lowest value in the 2024 set at 74.34%. Curaçao follows at 75.85%, Costa Rica at 79.07%, and Honduras at 81.37%. Venezuela is 88.99%. Australia is 90.22% and Algeria 91.38%. These figures indicate that other programme orientations account for a larger part of lower-secondary enrolment in these systems than in the many countries reported at 100%.
| Country/area | General programmes | Remainder to 100% |
|---|---|---|
| Mexico | 74.3% | 25.7% |
| Curaçao | 75.8% | 24.2% |
| Costa Rica | 79.1% | 20.9% |
| Honduras | 81.4% | 18.6% |
| Venezuela (Bolivarian Republic of) | 89.0% | 11.0% |
| Australia | 90.2% | 9.8% |
| Algeria | 91.4% | 8.6% |
| Lebanon | 93.6% | 6.4% |
| Niger | 94.0% | 6.0% |
| Mauritius | 95.0% | 5.0% |
The third column is a simple arithmetic complement, not a separate measurement added to the source. For Mexico, for example, 100 minus 74.34 leaves about 25.66 percentage points outside the general orientation. Under the UIS programme-orientation framework, the remainder is associated with vocational/technical or other reported orientation categories. It should not be translated into the name of one specific national school type without checking that country’s ISCED mapping.
A lower general share is not evidence of a weaker education system. It can reflect earlier differentiation between broad academic programmes and occupation-oriented programmes. Some systems maintain a common curriculum until upper secondary, while others open technical or vocational pathways during lower secondary. The statistic describes where that branching occurs and how much enrolment is affected; it does not establish which arrangement produces better results.
A single 2024 reference year improves comparability
All 120 retained observations are dated 2024. That is an important advantage for a cross-country comparison because many international education datasets combine the latest available value from different years. Here, there is no need to compare one country’s 2018 structure with another country’s 2024 structure. The Republic of Korea, along with many other reporting systems, is at 100%, indicating that all lower-secondary enrolment covered by this UIS classification is in general programmes.
A common reference year does not eliminate every comparability issue. Education reforms can change the point at which vocational pathways begin, and countries may revise their mapping of national programmes to ISCED categories. A 2024 value is a snapshot, not evidence of whether the share has risen or fallen. A trend claim would require several years of the same series.
National differences in programme structure limit fine-grained rankings
UIS explicitly cautions that cross-country comparability can be affected by the way secondary and post-secondary non-tertiary systems are organized by programme orientation. Vocational education may begin at lower secondary in one system but primarily at upper secondary in another. Apprenticeships, school-based technical programmes, company training and specialized institutions can also be assigned differently within national systems before they are mapped into the international classification.
For that reason, a two-point difference near the ceiling should not be treated as a meaningful performance gap. Large structural contrasts, such as the difference between values in the mid-70s and a 100% system, are more informative. It is also important not to confuse this indicator with the share of vocational students across all secondary education. A separate secondary-level series combines lower and upper secondary and may use different observation years, so the two percentages are not simple complements.
What this indicator cannot tell you about education outcomes
GTVP.2.GPV answers a narrow question: what percentage of lower-secondary enrolment is in general programmes? It does not measure reading or mathematics proficiency, completion, repetition, out-of-school rates, teacher supply, class size, spending per student, access to tertiary education or employment after graduation. Two countries with the same 100% value can have very different learning outcomes and very different pathways once students reach upper secondary.
A 100% value also does not prove that vocational education is absent from the country. Occupational programmes may be concentrated in upper secondary, post-secondary non-tertiary education, adult training or employer-based systems outside the scope of ISCED 2 enrolment. To describe a country’s overall vocational-education footprint, lower secondary needs to be considered alongside upper secondary, total secondary and post-secondary indicators.
Source and calculation method
The statistical source is UNESCO Institute for Statistics indicator GTVP.2.GPV. UIS defines programme-orientation percentages as enrolment in each orientation at a given level divided by total enrolment at that level. The data are generally drawn from censuses or administrative records of secondary and post-secondary non-tertiary institutions. The official definition and calculation method are available in the UIS metadata for percentage of students by programme orientation. The international level framework is described in the UIS ISCED documentation.
This analysis uses the 120 verified national and separately reported area rows dated 2024 from the UIS API for GTVP.2.GPV. No missing values are converted to zero. Source percentages are used directly; the counts above 95%, the mean, median, ranking of the lower tail, and the simple remainder to 100% are calculated from those rows. The mean is unweighted across reporting units.
Frequently Asked Questions
What does a 100% lower-secondary general-programme share mean?
It means all enrolment covered by the UIS ISCED 2 programme-orientation statistic is classified as general. It does not mean the country has no vocational education at upper-secondary or other levels.
Does a lower general-programme share mean lower education quality?
No. The indicator describes programme orientation, not learning outcomes, completion, school quality or employment results.
How many 2024 observations are included?
The verified dataset contains 120 countries and separately reported areas, all dated 2024. Eighty-five of them report exactly 100% in general programmes.
Is the 98.49% mean a global student enrolment rate?
No. It is an unweighted average of 120 country and area percentages. A global student-level rate would need to weight countries by their lower-secondary enrolment totals.
Related Articles
- Share of secondary students enrolled in vocational programmes
- Compulsory education duration by country in 2025
- Lower-secondary-or-higher educational attainment among adults age 25+
Green Map creates custom-edited map images using open geographic data sources such as geoBoundaries, Natural Earth, OpenStreetMap, and government open data.
These maps are edited visual materials, not raw data files, and are provided for education, documents, presentations, and graphic reference.