I’m running WordPress with Lightsail, and I suddenly noticed that the site was slowing down in the evening. At first, I thought it was a temporary issue, but the slowdown continued, so I checked to see if it was due to CPU overload.
However, since the CPU overload has been occurring for a few hours and the remaining CPU burst capacity has been exhausted, I hastily rebooted the instance. At first, the CPU was stable, but after 5 minutes, the overload occurred again.
So I ran a scan with my security plugin because I had been hacked before and there was no problem, and I checked my visitors because it might be a result of increased traffic and it was the same as yesterday.
I thought it was a temporary phenomenon because I had a sudden increase in CPU usage while running WordPress, but when I saw that it persisted, I searched and found articles with the same symptom.
There were people in foreign communities who had the same symptoms as me, and I tried the steps in order while referring to the articles that posted how to deal with them. After doing a few things, the CPU overload disappeared and there has been no increase in usage to date.
CPU overload in Lightsail can occur for a variety of reasons, but for those of you who are experiencing the same issue as I was, I’ll summarize the methods I used.
Table of Contents
CPU overload
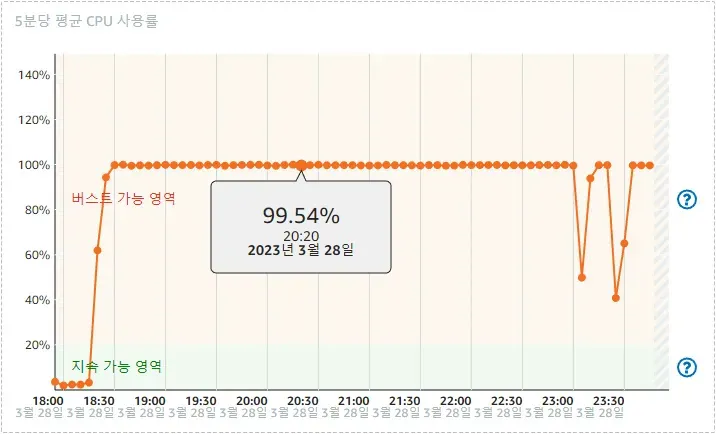
If you go to Lightsail > Instances > Metrics, you can see CPU usage. Here you can check if there is an overload. In my case, you can see that the graph went up sharply from 18:30.
If this condition persists, it will consume all remaining CPU burst capacity, so if you find it, you should take action to prevent the site from slowing down or freezing. Then, let’s find out how to deal with it in order.
Check CPU status
Lightsail metrics aren’t real-time, so you won’t get quick results, but using a monitoring tool will help you see what’s driving up CPU usage.
Monitoring tools are described in detail in the Amazon Knowledge Center , and among them, I used the htop tool to check the CPU status.
- htop tool: An interactive real-time process monitoring application for Linux that shows CPU or core-specific usage. The tool also provides meaningful text graphs for memory and swap usage.
The htop tool is not ready to use and needs to be installed on the server. You can do so by following the instructions below.
sudo apt install htop
If you click on an instance in Lightsail, there is a connection using SSH. After clicking on it and entering it, you can install htop by entering the command above.
htop
After completing the htop installation, if you type htop, the monitoring tool will run and you can monitor the CPU status in real time.
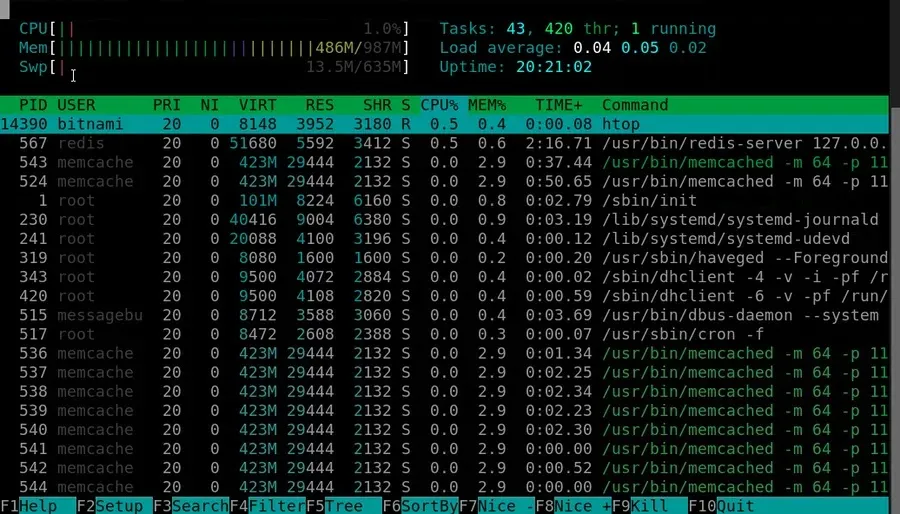
When you run the htop tool, a screen like the one above will appear. Here, you can check the real-time CPU status and find out which element is using a lot of CPU, so you can take action.
php-fpm: pool www
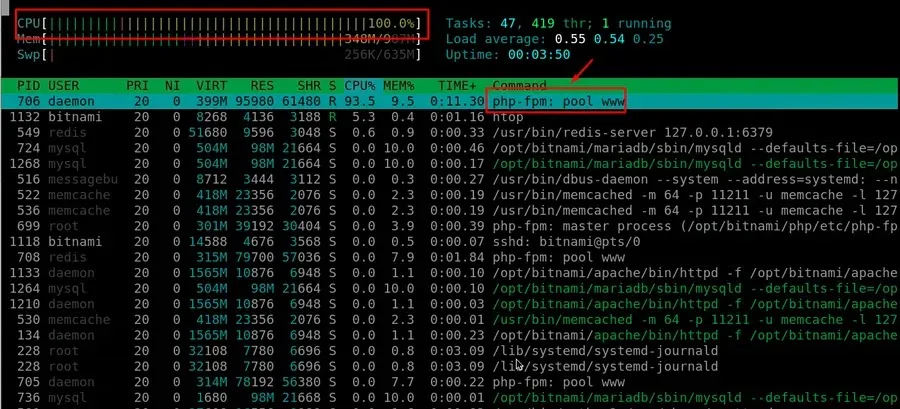
I ran the htop monitoring tool and checked, and I could see that the CPU usage was suddenly increasing in the element called php-fpm: pool www.
I’m not an expert so I couldn’t figure out what role it plays, but after searching, I found that it’s an administrator used to reduce the load and for quick processing. (Reference: php-fpm explanation post )
I roughly found out what role it plays through searching, but I couldn’t figure out why the CPU usage increased because of it. Then I found the answer in the bitnami documentation.
You can configure PHP-FPM processes per application. If you have many applications, this may result in excessive CPU usage.
If you see the above, it is an article about the problem I was experiencing, so I modified the configuration based on the bitnami documentation.
pm=ondemand
I went into the PHP-FPM path /opt/bitnmai/php/etc/php-fpm.d/www.conf and changed pm=dynamic to pm=ondemand. If you change it to that configuration, php-fpm will start automatically when needed.
In addition, the bitnami documentation says to modify two files, but I couldn’t find those files in the Lightsail I’m using. So, if you have those files, please refer to the bitnami documentation and modify the configuration.
sudo /opt/bitnami/ctlscript.sh restart php-fpm
If you have modified the configuration, you can restart php-fpm by connecting via SSH in Lightsail and entering the above command.
Then, if you look at htop monitoring, you will see that the CPU has decreased again. If the CPU overload does not go away even with this method, please refer to the document below.
Disable plugin

With the above method, one of the two sites got rid of the CPU overload, but the other one was still overloading. So I tried disabling plugins, which is what I check when I get errors when running WordPress.
As a result, I was able to disable the Wordfence security plugin and after a while, I could see that the overload phenomenon disappeared. So I searched and found that there were similar cases.
- Question about security program issues: wordfence and PHP-FPM high cpu usage
So, I was able to end the CPU overload issue by boldly deleting the Wordfence security plugin that I had been using and installing another security plugin.
The above may not be the exact solution, but if you are not an expert like me, you may be able to figure out your own problem and solve it just by looking at how I fixed it.
▶ How to set up WordPress .htaccess to work
▶ WordPress Widgets: How to Switch to the Older (Classic) Version
▶ Google Fonts – How to Speed Things Up by Removing Them in WordPress
