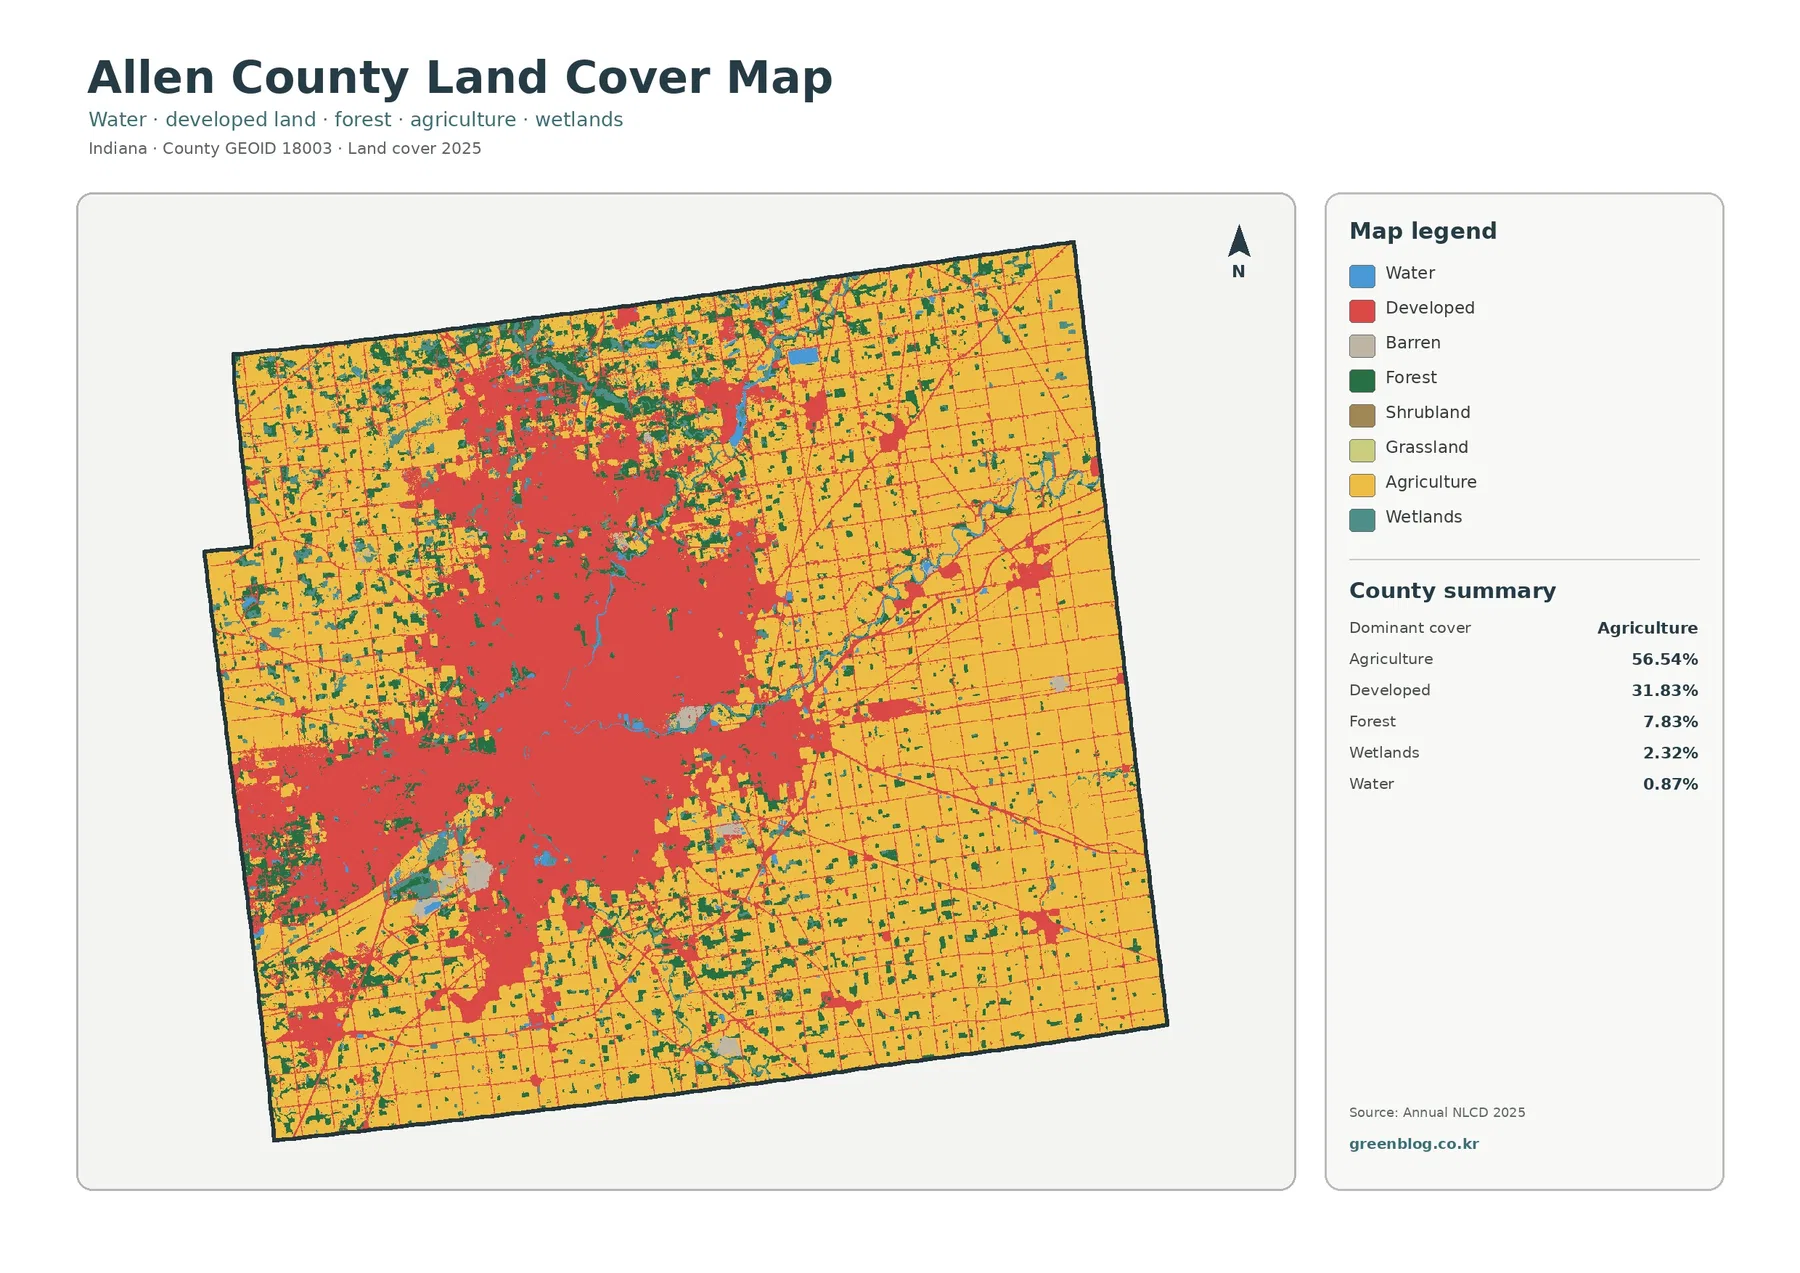
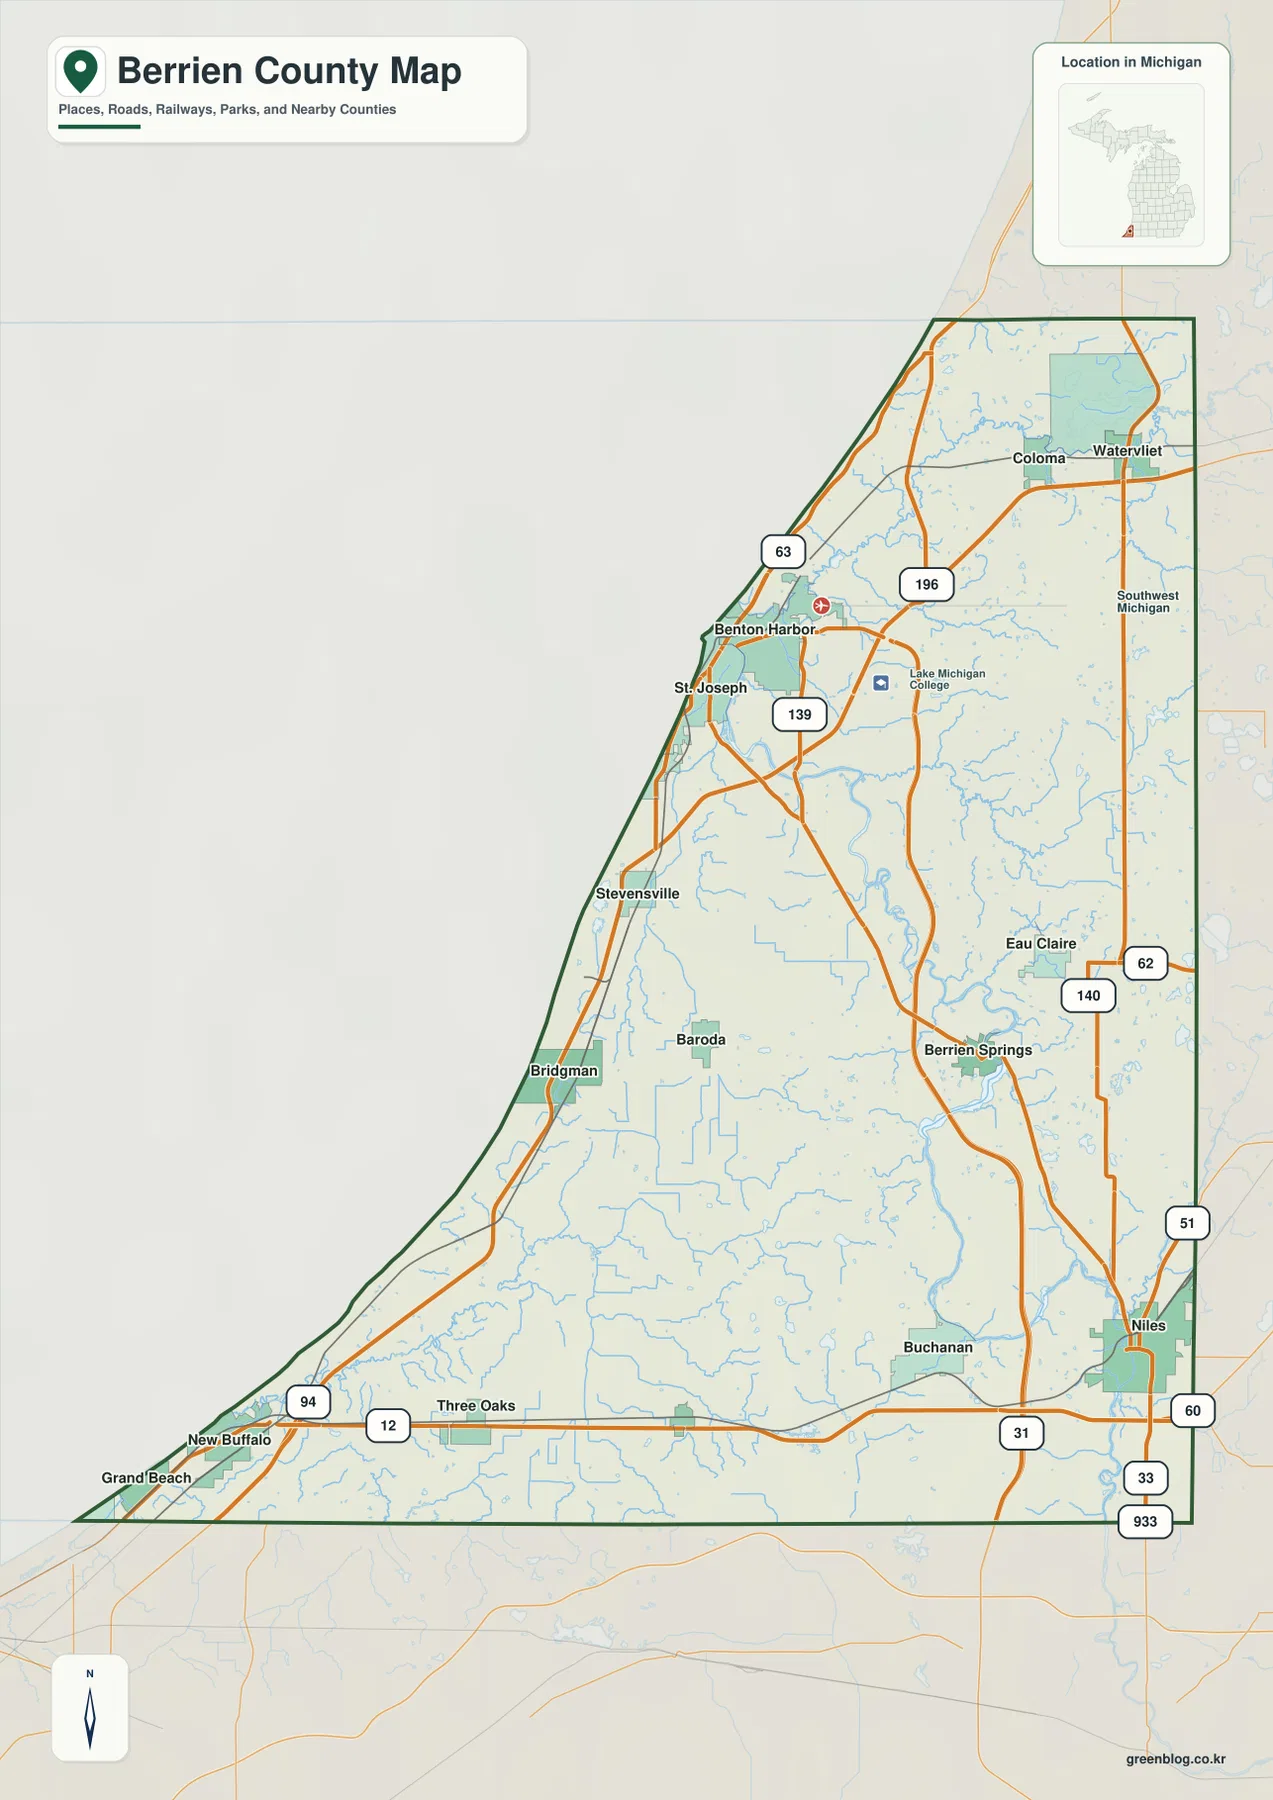
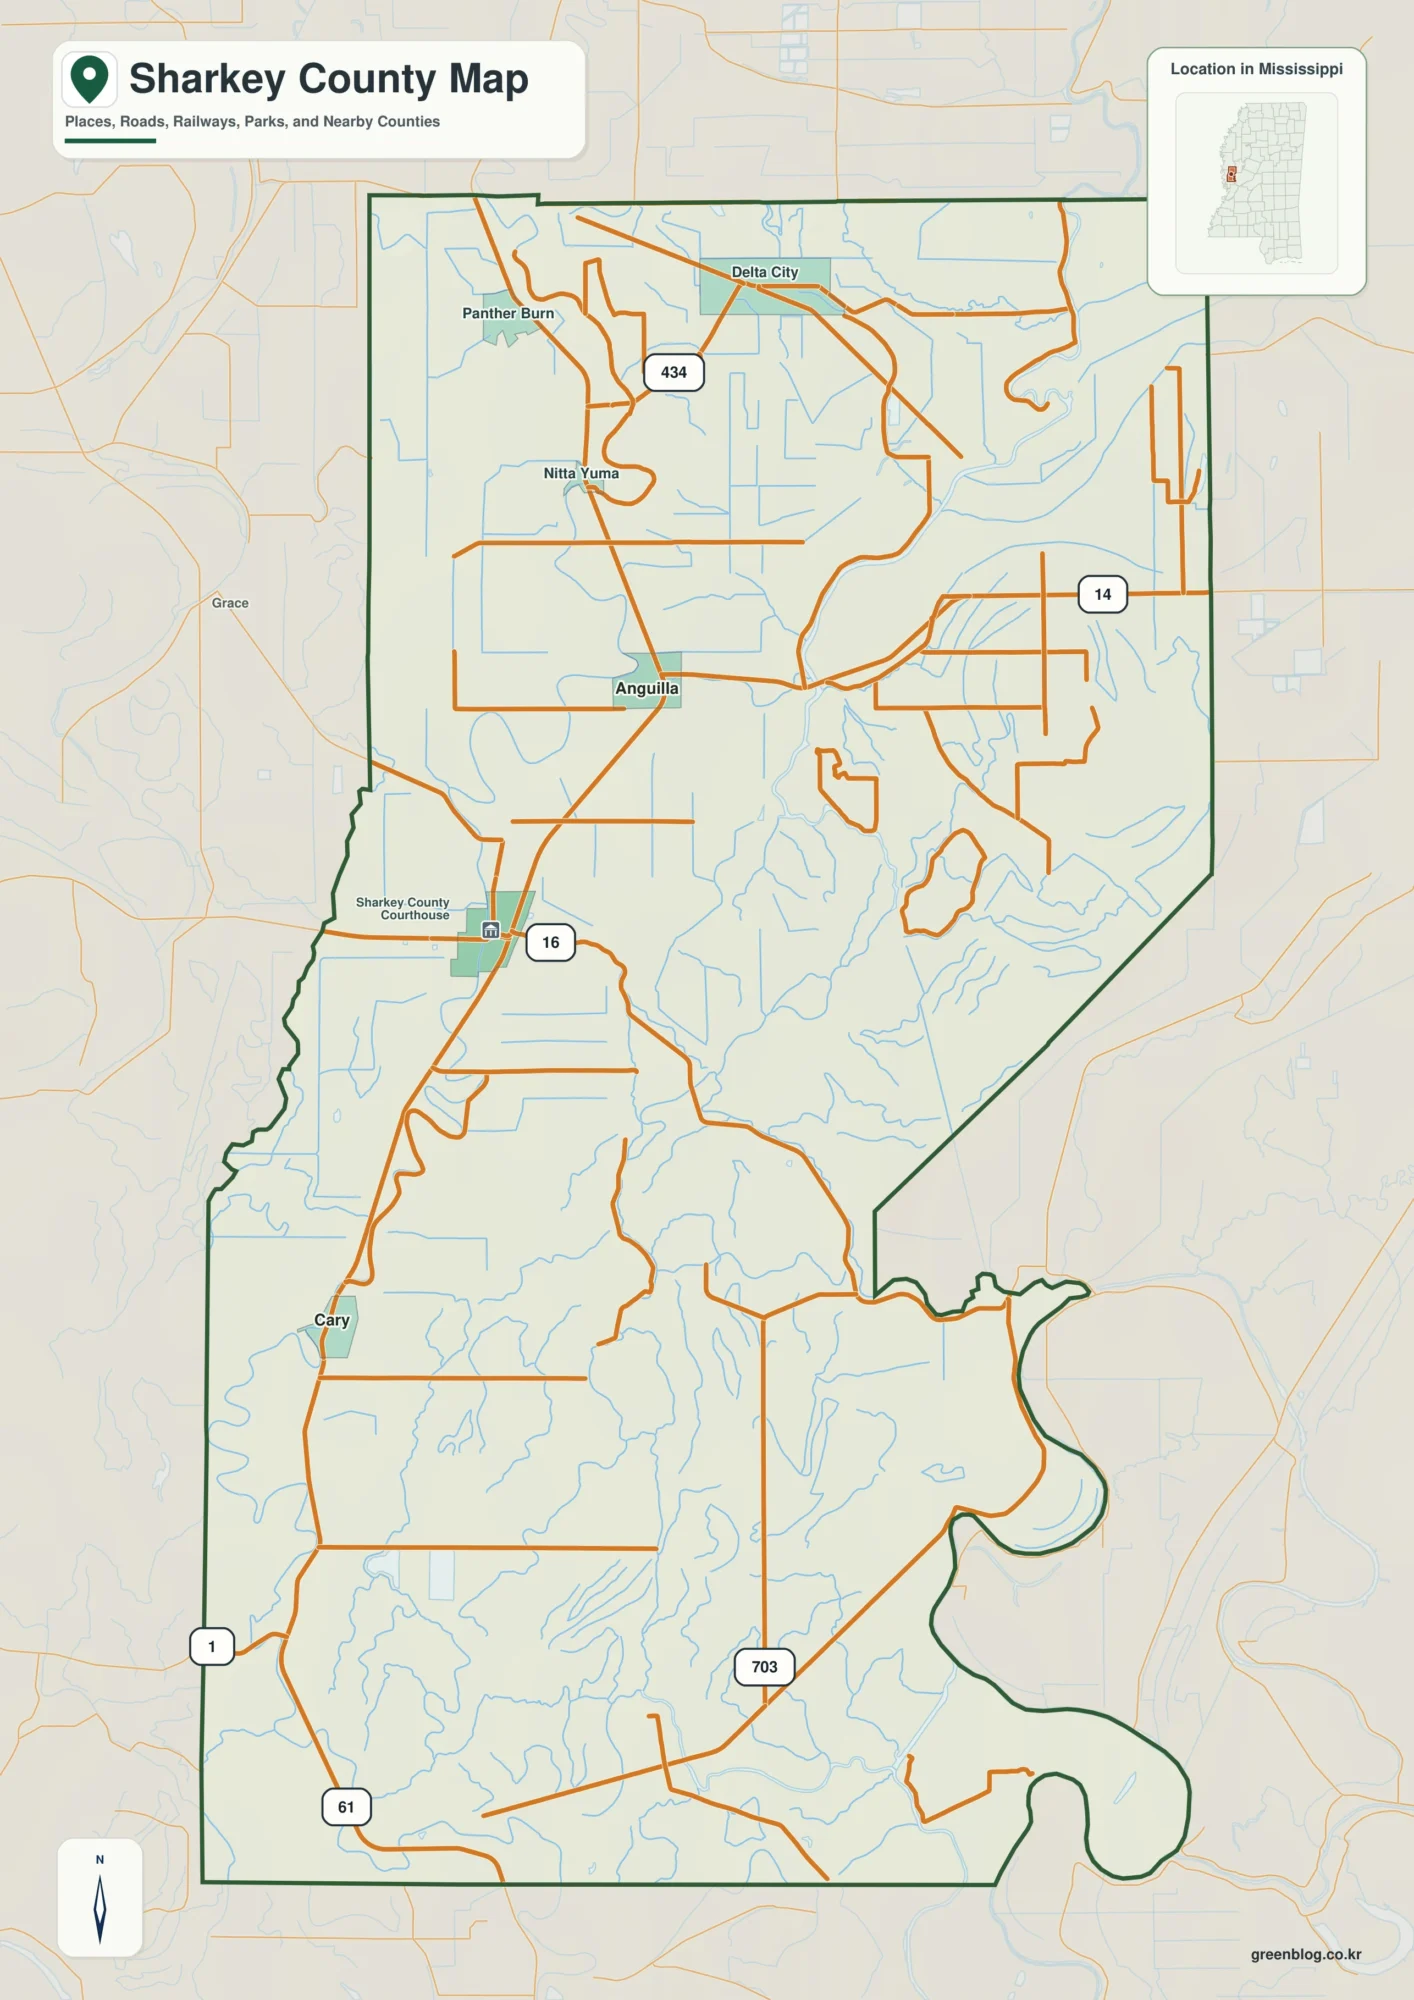
Hamilton County, Iowa, is largely agricultural, yet its four land-cover maps reveal striking local contrasts. Fields stretch across most of the county, while Webster City and the wooded Boone River corridor interrupt the pattern. Compare the 2025 cover map with the forest-and-farmland view, the impervious-surface map, and the 1985–2025 classification comparison to see those differences more clearly.
You can download all four original JPG maps together as one ZIP on this page. Begin with the countywide image to locate Webster City, then follow the same area through the other views. The legends help explain why a wooded river margin, a town block, and a farm field receive different colors; no single image answers every landscape question.
Table of Contents
Webster City stands out against a broad field pattern
Look first at the large blocks of cultivated land rather than the scattered towns. Agriculture covers 89.30% of Hamilton County in the supplied 2025 summary, giving much of the map a regular grid of fields. Wooded waterways and developed settlements interrupt that grid in small but noticeable patches. Their limited area does not make them unimportant to a person studying one particular location.
Webster City offers a clear landmark near the county’s developed core. Its clustered built-up pixels contrast with smaller settlements whose marks are less prominent at this scale. Lines across the fields correspond with the road pattern, but a mapped road is not proof that adjacent land is urban. Between communities, the surface remains predominantly agricultural in the displayed classification.
A winding green strip looks different from the straight edges of neighboring fields. Along parts of the drainage network, woodland bends and branches rather than following the road grid. The Boone River is a useful named landmark near Webster City, where parks and trails provide additional context. Identifying every minor green strip by river name would require a more detailed hydrographic map.
South and west of the main developed patch, the vegetation pattern becomes particularly easy to follow. Curving stretches break the otherwise rectilinear field layout and appear more prominent when the map is viewed as a whole. Forest represents a small countywide share, but a narrow corridor can still matter greatly in its immediate surroundings. Area percentages and spatial concentration answer different questions.
Local conservation sites provide another way to recognize the mapped landscape. Hamilton County Conservation maintains park and access information for places such as Briggs Woods and Little Wall Lake. These sources help identify familiar landmarks near water and woodland. A green cell on the map, however, cannot establish public ownership, legal protection, or permission to enter a property.
What the 2025 land-cover colors actually describe

Five cover groups account for most of the 2025 image: agriculture at 89.30%, developed land at 6.84%, forest at 2.25%, wetlands at 1.17%, and open water at 0.31%. Other categories occupy smaller areas. Those values describe how the surface was classified for the map year. They do not count farms, buildings, ownership parcels, or permitted land uses.
Across the northern, central, and southern portions of Hamilton County, cultivated fields form large contiguous stretches. Straight divisions follow the broad agricultural grid, while uneven green patches become more apparent near drainage features. Compare a field corner with a nearby curved band of vegetation to recognize the difference in geometry. Colors identify the mapped surface, not the legal boundary between neighboring properties.
Developed colors gather most visibly around Webster City, with smaller clusters marking other towns. This class can include more than pavement or rooftops; vegetation and managed open ground may occur within a developed landscape. It would therefore be misleading to treat every developed cell as completely sealed. The separate imperviousness image is designed to answer questions about the relative abundance of hard surfaces.
Where streamside woodland meets a low, wet area, two different shades can appear close together. Forest indicates tree cover, whereas wetlands describe another kind of surface environment. Blue water marks still another category. None of these colors tells a visitor whether a place is a public fishing access or whether a streambank is safe to approach; those questions need site-specific information.
Even a small countywide water share can include recognizable places. Briggs Woods Lake lies south of Webster City, and Iowa DNR identifies Little Wall Lake south of Jewell. Such landmarks provide useful reference points when comparing a map to local geography. Shoreline edges and minor ponds may be simplified at county scale, especially when the underlying cells represent mixtures of nearby surfaces.
Try using Webster City as an anchor for the first side-by-side comparison. Find the town in the 2025 overview, observe where the cultivated grid approaches its edges, and then look for neighboring vegetation patches. This method keeps a reader oriented across all four images. Avoid interpreting the edge of a color patch as a surveyed lot line or a zoning boundary.
Pavement is concentrated, but it is not the same as developed cover

Only 1.90% mean imperviousness is reported for Hamilton County in the supplied summary. Imperviousness measures how much of a mapped surface is covered by materials such as pavement and rooftops that resist water infiltration. It is distinct from zoning or the percentage assigned to the developed land-cover category. Knowing that difference prevents incorrect comparisons between the two maps.
On the impervious-surface view, Webster City has the strongest concentration of darker cells. Streets and built-up blocks appear together, while surrounding agricultural areas remain relatively light. Smaller towns show more limited clusters. This is a broad visual pattern, not a count of structures or a measurement of each individual property’s pavement.
Reading the graduated legend matters more than simply finding its darkest shade. The displayed bands run from 0% through 1–19%, 20–49%, 50–79%, and 80–100% imperviousness. One cell may contain a roof, lawn, driveway, and trees, so its estimate can fall between the extremes. A developed neighborhood can accordingly appear quite different from a parking area in this view.
Compare 6.84% developed cover with the 1.90% mean imperviousness figure, but do not subtract one from the other. Developed cover is a classification of land, while imperviousness is an estimated hard-surface fraction. Neither number reveals the county’s park acreage, individual building counts, or storm-drain capacity. Such questions require different datasets and sometimes local site measurements.
Fine road traces remain visible even when farms dominate the surrounding land. Their narrow, potentially impervious surfaces cut across fields without changing the broad agricultural character of each section. A zoomed-in image may help with orientation near an intersection. For engineering or access decisions, more accurate road records and recent photographs are still necessary.
Runoff is one possible reason to examine this image, but dark cells alone cannot establish flood risk. Soils, slope, rainfall, channels, drainage systems, and upstream conditions all affect how water moves. Use imperviousness to flag an area worth studying in greater detail. It is not a substitute for a hydrologic model or a local floodplain determination.
A closer reading of the Boone River and the farm margins

Cropland dominates the forest-and-farmland image, yet its green bands are easier to distinguish here than on the general cover map. A branching corridor stands out toward the southwest, and narrower strips follow other drainage lines. Tree cover appears concentrated near those features rather than distributed evenly through the fields. That contrast makes this view useful for studying agricultural margins.
Briggs Woods gives the wooded river setting a recognizable local reference. South of Webster City, the Boone River passes through a landscape that Hamilton County Conservation describes in terms of riverbank woodland and restored prairie. These descriptions help explain why several vegetation types may occur nearby. They cannot be used to assign protected status to every forest-colored cell on the map.
Two local trails illustrate the variety of places near town. Webster City’s Boone River Trail extends from Nokomis Park toward Briggs Woods Park, while Brewer Creek Trail passes a different creekside and prairie setting. The mapped mixture of developed cover and vegetation is consistent with that broader landscape context. Exact trail alignments, however, belong on official trail maps rather than a land-cover raster.
Curved forest edges next to rectangular fields deserve a closer look. Their shapes may follow terrain or drainage, but the imagery does not independently explain why they formed. Historic land management, elevation and soil conditions could all be relevant. Treat the pattern as an observation to investigate, not a proven causal history for any farm boundary.
Forest occupies 2.25% of the county overall, according to the 2025 summary. At a particular Boone River bend, its share of the visible scene may be much greater. That scale difference explains why a relatively uncommon cover type can dominate a local photograph. County averages are valuable for comparison, while the map reveals where the category is concentrated.
Beyond trees and crops, the legend includes grassland, pasture, shrubs and wetland categories. Their mapped patches tend to be smaller and less visually dominant here. Some lie near field edges or stream corridors, where different cover types meet. A small color patch is not enough to establish a plant community or wetland boundary without additional field or ecological information.
Narrow vegetation strips sometimes occupy only a handful of raster cells. Enlarging the JPG makes those cells easier to see, but does not add detail about individual trees. Recent aerial imagery can help locate a feature more precisely if its date and resolution are checked. The different layers may describe conditions from different years, so any comparison needs a careful caption.
The 1985–2025 comparison needs careful interpretation

Between the 1985 and 2025 endpoints, 4.56% of Hamilton County received a different land-cover classification, according to the supplied change map. Most of the area remains in the unchanged category, with scattered differences near towns, field margins and stream corridors. This figure is a comparison of mapped classes, not a continuous record of what happened during every intervening year.
Changes labeled ‘classified as developed’ cover 0.99% of the county in the comparison legend. Do not confuse that percentage with the 6.84% of land mapped as developed in 2025. One number refers to a specific change category between endpoint maps; the other describes the 2025 landscape. Both can be correct without representing competing estimates of urban land.
For other changes, the legend lists forest loss at 0.08%, agricultural-cover loss at 0.24%, and other class differences at 3.17%. These groupings identify how cells differ in the supplied comparison, not why a landowner changed a field or why a stream margin looks different. Historical photographs or local records would be needed to evaluate a particular location.
Purple patches belong to the broad ‘other class difference’ group. A reader should not translate them automatically into abandonment, construction or ecological damage. Multiple transitions can fall within that label, and classification uncertainty may matter at some boundaries. Only a more detailed layer or time series could explain a specific purple patch with confidence.
Against extensive agricultural cover, even scattered changed cells are easy to notice. The marks around Webster City invite comparison with today’s developed cluster; markings near river corridors call for a different comparison with vegetation and water classes. None of these patterns identifies when a structure was built or why a field edge changed. Countywide raster data cannot determine ownership history.
An endpoint map is useful for finding differences but leaves the years between them unseen. Annual data, when available for comparable methods, may offer a fuller sequence. A field could change class temporarily and return before 2025, which would not be apparent from the two endpoints alone. Use the image to frame questions rather than reconstruct a year-by-year local history.
Adding the four specified change categories yields 4.48%, while the legend reports 4.56% overall class differences. That 0.08-percentage-point gap should be disclosed rather than silently reassigned. The package does not establish whether the mismatch comes from rounding, an omitted detail or another calculation choice. Technical reuse calls for the source methodology and unrounded figures.
Local places that help explain the maps
At Briggs Woods Park, a real place anchors several otherwise abstract map colors. County conservation information places the park south of Webster City near the Boone River and describes woodland alongside prairie habitats. People using the maps for an outing should confirm trail conditions, parking and access with the park authority. Land-cover cells cannot substitute for an official park boundary.
Little Wall Lake offers a second landmark in the southern part of the county; Iowa DNR places it south of Jewell. Its small water feature helps connect a countywide percentage to a recognizable setting. At this scale, narrow shorelines and nearby land management features may not resolve clearly. Water quality, fishing rules and public access require separate lake-specific information.
Within Webster City, vegetation and development appear near one another along the river setting. The Boone River and Brewer Creek trails provide local examples of how a visitor can encounter riverbank trees, prairie areas and town streets in a relatively short trip. Proximity on a map does not prove that trail construction changed the surrounding land cover. Consult city resources for route details.
Parks, wildlife areas and river access sites managed by Hamilton County Conservation may help students connect mapped categories to the ground. A trip might compare a cultivated field edge with streamside woodland and town pavement. Before visiting, use the organization’s current site maps to check ownership and access. Those practical details are absent from the land-cover legend.
Field geometry makes a particularly accessible classroom example. Long straight edges surround cultivated sections near smaller communities, while winding wooded lines cut across the grid. Viewers can describe that contrast without knowing parcel ownership or crop yields. It offers a concrete way to discuss how agricultural and river-related surfaces occupy different parts of Hamilton County.
Using the four JPG maps in a report or classroom
A side-by-side display works best when each image answers a separate question. Place the 2025 cover map first to establish the agricultural background, then let the forest-and-farmland map reveal the narrower wooded corridors. Bring in imperviousness to show where hard surfaces concentrate near Webster City. The change view is reserved for differences between the two stated years.
Legends belong beside the images in a report or presentation. Without them, wetland colors may be mistaken for forest, or high imperviousness may be confused with total developed cover. Consistent orientation also helps when comparing one location across maps. Note the year and source under every panel so readers do not interpret a historical comparison as current conditions.
Consider asking students to locate Webster City and a smaller settlement before reading any percentages. They can compare how tightly impervious cells cluster and where fields approach the town edges. These are defensible visual observations. Population, business activity and property values cannot be inferred from pixel intensity and should be researched through other sources.
For a Boone River watershed lesson, start by tracing the green corridor through cultivated areas. County conservation references can then identify named parks and river access points along the broader landscape. Students may discover that the colored area does not correspond exactly to a managed site’s boundary. This distinction separates surface classification from legal stewardship.
JPG downloads are convenient for print handouts, image annotations and simple visual comparisons. Their apparent sharpness says little about positional accuracy, however. A small raster cell remains a generalized observation even when printed on a large sheet. Keep the archive for orientation and illustration, not for parcel surveys or decisions requiring precise boundary measurements.
Important limits before drawing conclusions
Raster classification simplifies complex ground conditions into mapped cells. A roadside strip may combine pavement, grass and trees while receiving a dominant cover class. Particularly near streams and field margins, narrow features may disappear or shift from one classified cell to another. Zooming cannot recover detail that was not present in the underlying source data.
Conditions on the ground can change after the 2025 observation represented in the general map. Construction, flooding or vegetation shifts may therefore be missing from the downloaded images. Likewise, the 1985–2025 comparison only describes those endpoints. Anyone making a conservation, construction or floodplain decision should obtain current authoritative records and site-level evidence.
A forest-colored pixel says nothing definitive about who owns the land or how it may legally be used. Agricultural pixels likewise do not identify crop rotation, yield or farm operations. These distinctions matter when someone wants to move from a general surface map to a property decision. Separate land-use, parcel and agriculture datasets answer those more specific questions.
Several sources support different parts of this page. MRLC and USGS explain land-cover classification; Census TIGER/Line provides geographic boundaries. Local park, trail and lake information comes from Hamilton County Conservation, Webster City and Iowa DNR. No single reference replaces the others, and a verified place description should not be treated as proof of a precise land-cover boundary.
When reusing a Hamilton County percentage, identify it as a value from the supplied map legend and state the relevant year. County boundaries, classification methods and data versions may differ across products. Apparent disagreements deserve a method check before one source is called incorrect. Clear attribution also makes it easier for readers to reproduce a comparison with the appropriate data.
Frequently Asked Questions
Why does woodland stand out along the Boone River when most of Hamilton County is farmland?
Forest accounts for only 2.25% of the county, while agricultural cover reaches 89.30%. Along the Boone River, however, trees form locally prominent corridors through extensive fields. Countywide percentages describe totals rather than the shape or concentration of each class. Check conservation maps separately for public access and ownership.
Is the 1.90% imperviousness figure another estimate of developed land?
No. The 2025 overview assigns 6.84% of the county to developed cover; the imperviousness layer reports a 1.90% mean share of hard surfaces within mapped cells. Grass and trees may occur inside developed areas, so these measures are not interchangeable. Subtracting them does not calculate the amount of open parkland.
Does a 4.56% class difference mean that Hamilton County lost 4.56% of its farmland?
Not at all. The 4.56% value counts locations whose assigned classes differ between 1985 and 2025. Agricultural-cover loss is a separate category in the legend, and the comparison does not show the full sequence of changes between those years. Treat the total as a classification difference, not a farmland-loss rate.
Which downloadable image should I use to compare Webster City with the river corridor?
Begin with the general 2025 map to place Webster City and the Boone River on the same county outline. Next, examine imperviousness for clustered town surfaces and forest-and-farmland for wooded stream margins. Consult the change view only when comparing the stated endpoints. The download box provides the four original JPG images together.
Map File Information
Download one ZIP archive containing the four original land-cover map JPG files.
- Included Files: Four original land-cover map JPG files
- File Type: ZIP archive containing four JPG files
- Intended Use: Map comparison, learning, and print reference
Related Maps
- Adair County Iowa Land Cover Map
- Adams County Iowa Land Cover Map
- Allamakee County Iowa Land Cover Map
Official sources and regional references
USGS Annual NLCD classification guide
U.S. Census TIGER/Line county boundaries
Hamilton County Conservation: Briggs Woods Park
Webster City parks: Boone River and Brewer Creek trails
Iowa DNR lake and reservoir directory
Green Map creates custom-edited map images using open geographic data sources such as geoBoundaries, Natural Earth, OpenStreetMap, and government open data. These maps are edited visual materials, not raw data files, and are provided for education, documents, presentations, and graphic reference.