A country can have a high lower-secondary completion rate and still show a gender gap, or it can have low completion for both girls and boys while appearing close to gender parity. The adjusted gender parity index (GPIA) separates the question of balance between the sexes from the question of the overall completion level. UNESCO Institute for Statistics (UIS) indicator CR.MOD.2.GPIA measures the gender balance in modelled lower-secondary completion rates for 2025.
The index is centered on 1 rather than expressed as a percentage. A value of exactly 1 means the female and male completion-rate values are equal. For an indicator such as completion, where higher values are desirable, a value below 1 points to a lower female completion rate relative to the male rate, while a value above 1 points in the opposite direction. Because UIS adjusts ratios above 1, the scale is designed to make disparities on either side of parity more comparable.

Table of Contents
What the adjusted gender parity index actually measures
UIS explains in its parity-index methodology that a parity index starts from a comparison of one population group with another. The adjusted version transforms ratios above 1 so that the index is symmetric around 1 and bounded between 0 and 2. This matters because an ordinary female-to-male ratio is not symmetric: a ratio of 2 and a ratio of 0.5 are not equally distant from 1. The adjustment makes the direction and approximate magnitude of disparity easier to compare.
GPIA does not tell us the female or male completion rate by itself. A value of 1.00 could occur when both groups have very high completion, when both have moderate completion, or when both have low completion. To judge the level of educational attainment or access, the underlying sex-specific completion rates are still required. The parity index answers a narrower question: how closely do the two rates align?
The center of the 2025 distribution is close to parity
The dataset contains 164 reported countries and territories. The mean GPIA is 1.026 and the median is 1.017. The first quartile is 1.001 and the third quartile is 1.095. This places much of the distribution near 1, although the upper half extends far enough above 1 to lift the mean and median slightly above exact parity.
A commonly used UIS parity band is 0.97 to 1.03. In the 2025 observations, 72 places fall inside that interval, 22 fall below 0.97, and 70 are above 1.03. Those counts show why a single average is not enough: substantial numbers of observations sit on both sides of the parity band, and the direction of the gap differs across countries and territories.

| Summary | 2025 value |
|---|---|
| Reported countries/territories | 164 |
| Mean GPIA | 1.026 |
| Median | 1.017 |
| First quartile | 1.001 |
| Third quartile | 1.095 |
| Within 0.97–1.03 | 72 |
| Below 0.97 | 22 |
| Above 1.03 | 70 |
| Minimum | 0.379 |
| Maximum | 1.392 |
Values below and above 1 point in opposite directions
At the low end, Niger records 0.379, followed by Somalia at 0.433, South Sudan at 0.511, Chad at 0.556, and Mozambique at 0.621. For a completion-rate indicator, values below 1 indicate that the female completion-rate value is lower than the male value. The farther the index falls below 1, the larger the disparity in that direction.
At the high end, Lesotho records 1.392, Ethiopia 1.322, Belize 1.296, Namibia 1.286, and Haiti 1.284. Values above 1 indicate a higher female completion-rate value than the male value. This does not make the high values ‘better’. A large value above 1 is still a sign of gender disparity, only in the opposite direction from a low value below 1.
| Lower-side observations | GPIA | Upper-side observations | GPIA |
|---|---|---|---|
| Niger | 0.379 | Lesotho | 1.392 |
| Somalia | 0.433 | Ethiopia | 1.322 |
| South Sudan | 0.511 | Belize | 1.296 |
| Chad | 0.556 | Namibia | 1.286 |
| Mozambique | 0.621 | Haiti | 1.284 |

Why 0.97–1.03 is useful but should not be treated as a cliff
UIS materials such as its explanation of adjusted GPI commonly use 0.97–1.03 as a practical parity range. The band allows for small differences rather than demanding numerical identity to several decimal places. It is a useful descriptive threshold, but it should not be interpreted as if 1.029 were substantively equal and 1.031 suddenly represented a completely different education system.
Small movements close to the boundary need context. Model estimates, revisions, sample information in the underlying sources, and changes in the sex-specific completion rates can all matter. For countries already close to 1, the underlying rates and a multi-year series usually provide more information than a rank based on the third decimal place.
Extreme GPIA values need the underlying completion rates
A large departure from 1 identifies a place where the female and male completion-rate values differ substantially, but the parity index alone cannot reveal whether one rate is high, the other is low, or both are low at different levels. Two countries with the same GPIA can therefore face very different education challenges. One may need to raise completion for both sexes; another may have a more concentrated gender gap.
The indicator is also explicitly described as modelled data. Modelled estimates help create comparable country series where raw observations differ in timing or availability, but they are not a substitute for reading the country-specific source evidence. For policy or program evaluation, the appropriate next step is to inspect the female and male completion rates, their uncertainty, and the national data behind the modelled series.
The map is best used as an exploration tool
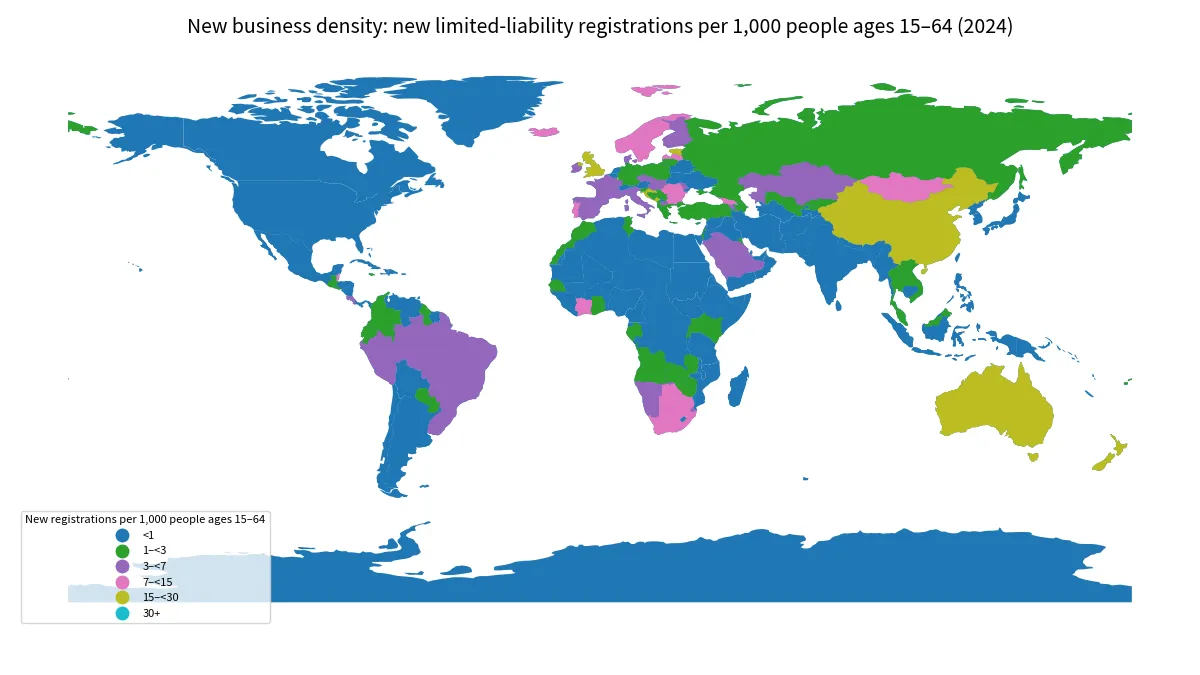
Mapping the index makes it easier to see where departures from parity are located and whether nearby observations appear similar. That visual pattern can generate useful questions, but geographic proximity is not an explanation. Education systems differ in school structure, entry age, conflict exposure, household conditions, social expectations, and the availability of source data. Similar map colors can therefore arise for very different reasons.
The map included here matches 152 of the 164 reported UIS observations to a low-resolution world boundary file. Several small states and territories are not represented by that base geometry even though their values remain in the statistical tables and calculations. Unmapped areas are not zero and should never be interpreted as having no gender disparity.

What this indicator can and cannot tell us
GPIA can identify whether lower-secondary completion is close to gender parity, the direction of a gap, and how far an observation lies from the parity point. With a time series, it can also show whether a country is moving toward or away from parity. Those are useful questions for monitoring educational equity.
It cannot, by itself, explain school quality, learning outcomes, household costs, safety, teacher supply, the reasons students leave school, or the overall level of lower-secondary completion. A country at 1.00 may still have a serious completion problem affecting both sexes. A country far from 1 may simultaneously have a high completion level for the relatively advantaged group. Gender balance and overall attainment should therefore be examined together rather than collapsed into one judgment.
A better way to compare countries
First, read the index around 1 rather than as a conventional league table. Values close to 1 indicate similar female and male completion rates; values far from 1 indicate larger disparities. Second, preserve the direction: below 1 and above 1 are not interchangeable because they identify different relative positions of girls and boys. Third, avoid overinterpreting tiny differences within or near the parity band.
Fourth, when an observation is far from 1, check the underlying female and male completion rates before drawing conclusions about the education system. Fifth, compare multiple years when possible, especially for modelled series that may be revised. Finally, combine parity with the overall completion rate and other measures of access and learning. That approach keeps an equity indicator from being mistaken for a complete measure of educational performance.
Source and interpretation limits
The values used here come from the UNESCO Institute for Statistics CR.MOD.2.GPIA 2025 series. The calculation and interpretation of parity indices are described by UIS, and the wider dataset can be explored through the UIS Data Browser. All 164 reported country and territory observations are retained as published; missing places are not filled with zeros.
The 2025 median is 1.017, and 72 observations are within 0.97–1.03. At the same time, 22 are below that band and 70 are above it. The central lesson is simple: the closer GPIA is to 1, the closer the female and male lower-secondary completion-rate values are to parity. The farther it is from 1, the larger the disparity, with the side of 1 indicating its direction.
Frequently Asked Questions
What does a lower-secondary completion GPIA of 1 mean?
It means the female and male completion-rate values are equal. Values closer to 1 indicate greater gender parity.
Why is 0.97–1.03 often used as a parity range?
UIS commonly uses this band as a practical tolerance around exact equality. Very small differences near the boundary should still be interpreted with the underlying rates and data context.
Does a GPIA above 1 mean a country has better education outcomes?
No. For completion rates, a value above 1 indicates that the female completion-rate value is higher than the male value. It measures the direction of disparity, not the overall quality or level of education.
Related Articles
Green Map creates custom-edited map images using open geographic data sources such as geoBoundaries, Natural Earth, OpenStreetMap, and government open data. These maps are edited visual materials, not raw data files, and are provided for education, documents, presentations, and graphic reference.