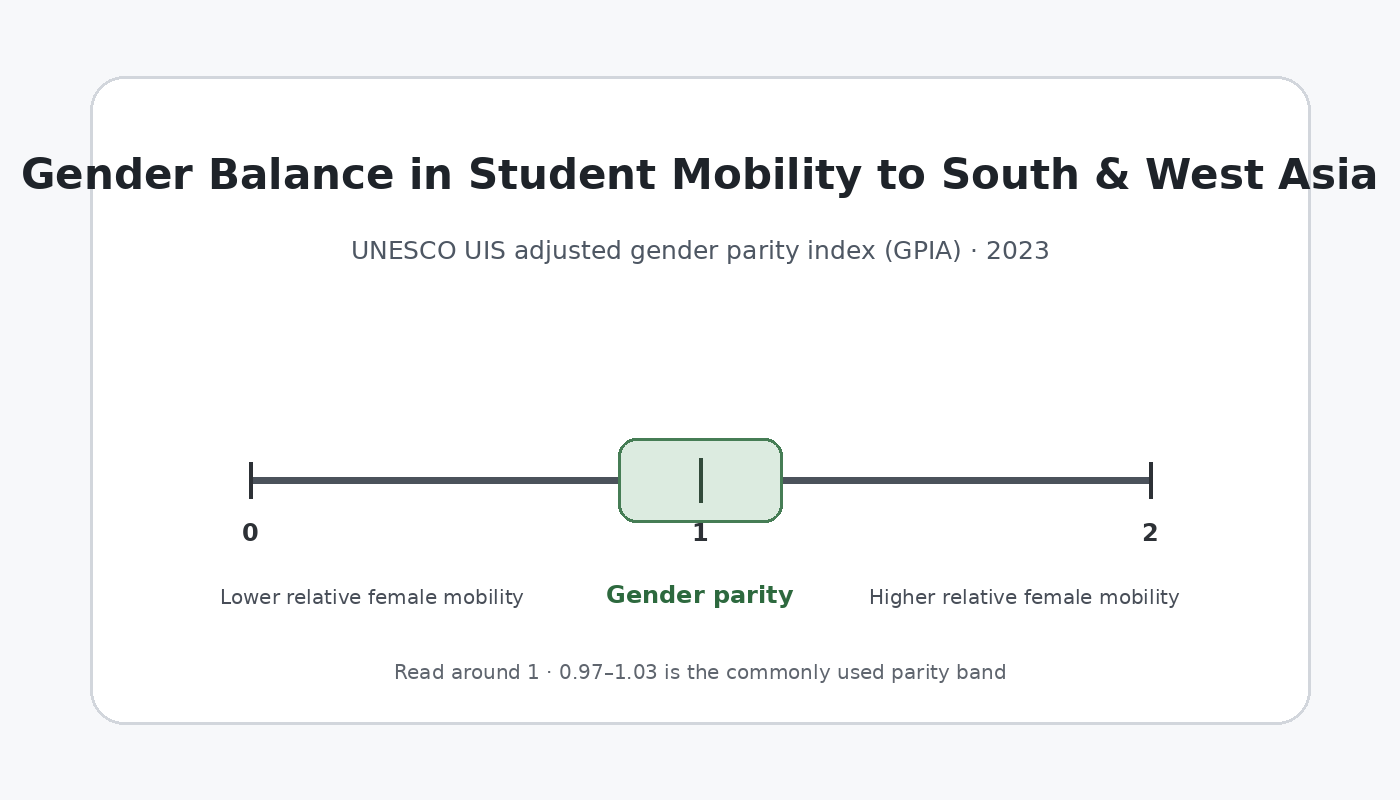
The 2023 UNESCO Institute for Statistics series OE.5T8.40522.GPIA describes the gender balance of internationally mobile tertiary students from each origin country who study in Latin America. The extract contains 199 published country and area observations. Its measure is the adjusted gender parity index, a 0-to-2 scale centered on 1.00. Equality of the female and male indicator values corresponds to 1.00; values below 1 indicate a lower female value, while values above 1 indicate a higher female value.
The dataset is unusual because it is not a smooth continuum. Exactly 119 observations equal 1.00, 38 equal 0.00 and 41 equal 2.00. Saudi Arabia, at 1.57143, is the only observation between those three common points. This shape makes a conventional country ranking misleading. The more informative questions are how many observations fall inside the parity band, what the mathematical endpoints mean, and what cannot be inferred without the underlying student counts.

Table of Contents
What this series is measuring
The geography in this series is best read from the origin side. Each row refers to an origin country or area, while the destination region is Latin America. The measure therefore asks whether the female and male values associated with internationally mobile tertiary students from that origin who study in Latin America are balanced. It does not rank Latin American destination systems or identify a particular host country.
The adjusted gender parity index is a relationship measure rather than a headcount. An origin with a value of 1.00 may represent a large flow or only a few students. An origin at 0.00 or 2.00 may also be small in absolute terms. To measure scale, the sex-specific student counts or a total mobility count must be examined separately.
That distinction matters for international mobility because some origin-to-region flows can be sparse. If the underlying count for one sex is zero, the index can move to an endpoint even when the number of students involved is modest. The direction of a parity index and the social magnitude of a flow are therefore different questions.
Nearly 60% of observations are in the parity band
UIS commonly interprets values from 0.97 to 1.03 as practical gender parity. On that basis, 119 of the 199 observations, or 59.8%, are inside the parity band. There are 38 observations below 0.97, representing 19.1% of the dataset, and 42 above 1.03, representing 21.1%. The median is 1.00 and the unweighted mean is 1.018.
| GPIA range | Observations | Share | Direction |
|---|---|---|---|
| Below 0.97 | 38 | 19.1% | Female value below male value |
| 0.97–1.03 | 119 | 59.8% | UIS practical parity band |
| Above 1.03 | 42 | 21.1% | Female value above male value |
The quartiles reveal more than the mean. The 25th percentile, median and 75th percentile are all exactly 1.00, so the central half of the distribution collapses to a single value. In a continuous indicator, a mean or detailed rank order might capture gradual differences. Here, the frequency at a small set of values is the dominant statistical feature.
The mean of 1.018 should therefore not be described as the typical origin country having a small female-leaning imbalance. It is an arithmetic result produced by 38 zeros, 119 ones, 41 twos and the single value of 1.57143. The modal and median observation is exactly parity.
Why 0 and 2 need careful interpretation
The adjusted form was created to make parity ratios symmetric around 1. When the female indicator value is less than or equal to the male value, the female-to-male ratio is used. When the female value is higher, the formula is adjusted so that the result stays on a 0-to-2 scale and equal-sized departures from 1 can be compared in opposite directions.
On this scale, 0 is the lower bound and 2 is the upper bound. An exact zero can occur when the female value of the underlying indicator is zero and the male value is positive. An exact two can occur when the male value is zero and the female value is positive. The 2023 extract contains 38 zeros and 41 twos, so endpoint values are not rare in this series.
The supplied table does not include the female and male source counts, which prevents us from reconstructing the absolute number of students behind each endpoint. For that reason, an endpoint should not be turned into a league table of the “largest” gender gaps. It marks an extreme ratio condition in this particular mobility indicator, not the overall state of gender equality in an origin country.
Saudi Arabia is the only intermediate observation
Saudi Arabia has a GPIA of 1.57143, the only value in the dataset that is not exactly 0, 1 or 2. Because it is above 1, the female indicator value is higher than the male value, and because it exceeds 1.03 it lies outside the practical parity band. The value should still be read as an adjusted index rather than converted directly into a student headcount.
Its uniqueness also demonstrates why a many-class choropleth would imply more precision than the data contain. A map shaded with numerous color intervals might suggest a gradual geographic surface, but 198 of the 199 published observations occupy only three exact values. A frequency display communicates that structure more honestly.
Examples at the lower, parity and upper values
Examples at 0.00 include Bangladesh, Benin, Burkina Faso, Ethiopia, Ghana, Jordan, Kenya, Morocco, Nepal, Pakistan, Senegal and South Sudan. Examples at 2.00 include Andorra, the United Arab Emirates, Bahrain, Cyprus, Czechia, Finland, Iceland, Kazakhstan, Lithuania, Malta, Mongolia and Paraguay. These are examples from the published rows, not a ranking or a claim that the same mechanism explains every case.
A large group of origins is exactly at 1.00, including Argentina, Brazil, Chile, Colombia, Mexico, Peru and Uruguay. The fact that many Latin American origins sit at 1.00 is descriptive, but the indicator cannot tell us why. Language, distance, tuition, scholarships, institutional partnerships, visa rules, fields of study and historical ties can all affect mobility, yet none of those mechanisms is identified in the GPIA series itself.
Why a distribution chart is preferable to a world map
Country-level data are often mapped by default, but territorial area has no relationship to the number of internationally mobile students. On a choropleth, a large country can dominate the page even if the relevant student flow is tiny, while small islands or territories can nearly disappear. That visual imbalance becomes more problematic when most values are identical.
The distribution chart instead gives every observation the same statistical weight and makes the data structure visible immediately: 119 at parity, 38 at the lower endpoint, 41 at the upper endpoint and one intermediate value. The important information in this extract is the discrete pattern, not a smooth spatial gradient.
A map would become more informative if it were paired with counts, destination-country detail, or a less discrete indicator. With the current extract, a simple distribution view avoids false precision and discourages readers from equating land area with the importance of an international-student flow.
Observed zero is not the same as missing data
The official dataset distinguishes published observations from places without a reported value. The 199 rows used here are observed values. Countries and areas that are absent from the extract must not be filled with zero, because “not reported” and a published GPIA of 0.00 have completely different meanings.
Replacing missing observations with zero would inflate the number of lower-endpoint cases and distort the mean, the parity shares and any map. The same rule should be retained when comparing years: use only actual observations unless the source explicitly defines another missing-value treatment.
Questions this indicator cannot answer by itself
The GPIA does not reveal how many students studied in Latin America, which Latin American country hosted them, which universities they attended, what subjects they studied, or what proportion of all outbound students from an origin chose Latin America. It is a narrow relational indicator that compares female and male values for a specific mobility concept.
A stronger follow-up analysis would add female and male headcounts, a bilateral origin-destination matrix and a time series. Counts would distinguish a ratio based on a handful of students from one involving a large flow. Destination detail would show whether mobility is concentrated in one national system or distributed across the region. Multiple years would indicate whether endpoint values persist or fluctuate with small annual changes.
Source and calculation notes
The 2023 country and area values come from the official UNESCO Institute for Statistics API for indicator OE.5T8.40522.GPIA. The 0-to-2 construction of the adjusted parity index and the common 0.97–1.03 parity band follow the UIS methodological explanation of the adjusted gender parity index.
All 199 published observations were retained as supplied; unreported catalogue units were not converted to zero. The counts, percentages, mean and median in this article were calculated directly from the 2023 values. When comparing this series with another mobility indicator, the indicator code, destination region, observation year and origin-country dimension should be checked first because similarly named series can describe different flows.
Frequently Asked Questions
Does a GPIA of 1.00 mean the female and male student counts are identical?
It means the female and male values of the underlying indicator are equal. The GPIA table alone does not provide the actual number of students behind those values.
Do values of 0.00 or 2.00 mean a country sends many students to Latin America?
No. They are endpoints of the adjusted parity scale, not measures of volume. Sex-specific or total student counts are needed to assess the size of the flow.
Why use a distribution chart instead of a country map?
Because 198 of the 199 observations are exactly 0, 1 or 2. A frequency chart shows that discrete structure directly, while a choropleth could suggest a continuous spatial pattern that is not present.
Related Articles
Green Map creates custom-edited map images using open geographic data sources such as geoBoundaries, Natural Earth, OpenStreetMap, and government open data. These maps are edited visual materials, not raw data files, and are provided for education, documents, presentations, and graphic reference.