The World Bank indicator NE.CON.TOTL.KD.ZG measures the annual real growth of final consumption expenditure. Among economies with an observation for 2025, there are 133 usable values. The median growth rate is 3.23%, while the mean is 3.64%. The middle half of observations lies between 1.93% and 4.96%.
This is not simply a nominal spending-growth measure. The World Bank describes final consumption expenditure as spending by resident institutional units on goods and services used for the direct satisfaction of individual or collective needs. The annual growth series is calculated from constant-price data, with a 2015 base, so it is designed to track changes in real consumption rather than changes caused only by higher prices.
The source file contains 176 latest non-empty country/economy observations, but the reference years are not uniform. 133 are from 2025, 30 are from 2024, and 13 are older. To avoid mixing different points in time, all rankings, summary statistics, charts and the map in this article use the 2025 subset only.

Table of Contents
What final consumption expenditure growth actually measures
Final consumption expenditure is broader than household consumption. It combines expenditure that directly satisfies private needs with final consumption provided for collective or individual purposes by government. That is why this total can move differently from either the household-only or government-only series. A country can have strong household consumption and weak government consumption, or the reverse, while the combined measure records the net result.
The indicator is a growth rate, not a level. A value of 5% means that real final consumption expenditure was about 5% higher than in the previous year. It does not mean that final consumption equals 5% of GDP, nor does it show how many dollars were spent. Large and small economies can therefore have similar growth rates even though the absolute amount of consumption is very different.
A negative value also needs careful interpretation. It does not mean consumption is negative; it means the inflation-adjusted level fell compared with the previous year. Likewise, a very high positive value is evidence of rapid expansion in that year but is not, by itself, proof of stronger welfare, healthier public finances, or higher household purchasing power. Those questions require additional indicators.
Most 2025 observations were positive, but growth rates varied widely
Of the 133 observations for 2025, 123 are above zero and 9 are below zero; Bulgaria is recorded at exactly 0%. There are 33 economies at or above 5% growth and only 4 at or above 10%. The dominant pattern is therefore modest positive growth rather than widespread double-digit expansion.
The median of 3.23% is slightly below the mean of 3.64%, showing that a small group of high-growth observations pulls the average upward. The 2025 range runs from Samoa at -3.88% to the Kyrgyz Republic at 20.80%. That full range looks dramatic, but the interquartile range of roughly 1.93% to 4.96% gives a better sense of where a typical observation sits.

Which economies recorded the fastest growth in 2025?
The Kyrgyz Republic has the highest 2025 observation at 20.80%. Libya follows at 11.48%, Uganda at 10.48%, Georgia at 10.33%, and Armenia at 9.90%. The leading group spans Central Asia, the Caucasus, North Africa and Sub-Saharan Africa, so the top of the table does not point to a single continental pattern.
These rankings are descriptive rather than a scorecard. Strong growth can reflect a rebound from an unusually weak previous year, recovery in household demand, higher government consumption, reconstruction, or other temporary and structural factors. The aggregate series does not separate those causes. It is therefore safer to treat the ranking as a signal about the size of the annual change and then investigate the country-specific context with complementary data.

| Country/economy | 2025 growth |
|---|---|
| Kyrgyz Republic | 20.80% |
| Libya | 11.48% |
| Uganda | 10.48% |
| Georgia | 10.33% |
| Armenia | 9.90% |
| Guinea | 9.15% |
| Egypt, Arab Rep. | 8.39% |
| Viet Nam | 7.95% |
| Uzbekistan | 7.86% |
| Rwanda | 7.85% |
A small group recorded real declines
At the lower end, Samoa records -3.88%, Venezuela -3.03%, Mozambique -2.14%, Brunei Darussalam -1.35%, and Botswana -1.12%. Haiti, Iran, Finland and Romania also have slightly negative values. These observations show that real final consumption expenditure fell from 2024 to 2025, but the indicator does not tell us whether the contraction came mainly from households, government, or both.
The reasons behind a decline can differ sharply across economies. Fiscal consolidation, weaker household income, import constraints, natural disasters, political disruption, or a reversal after unusually strong prior-year growth can all matter. None of those explanations should be inferred directly from the rank alone. The series is useful for identifying where consumption changed, not for assigning one common cause.
| Country/economy | 2025 growth |
|---|---|
| Samoa | -3.88% |
| Venezuela, RB | -3.03% |
| Mozambique | -2.14% |
| Brunei Darussalam | -1.35% |
| Botswana | -1.12% |
| Haiti | -0.95% |
| Iran, Islamic Rep. | -0.47% |
| Finland | -0.24% |
| Romania | -0.19% |
| Bulgaria | 0.00% |
The world map shows mixed patterns within regions
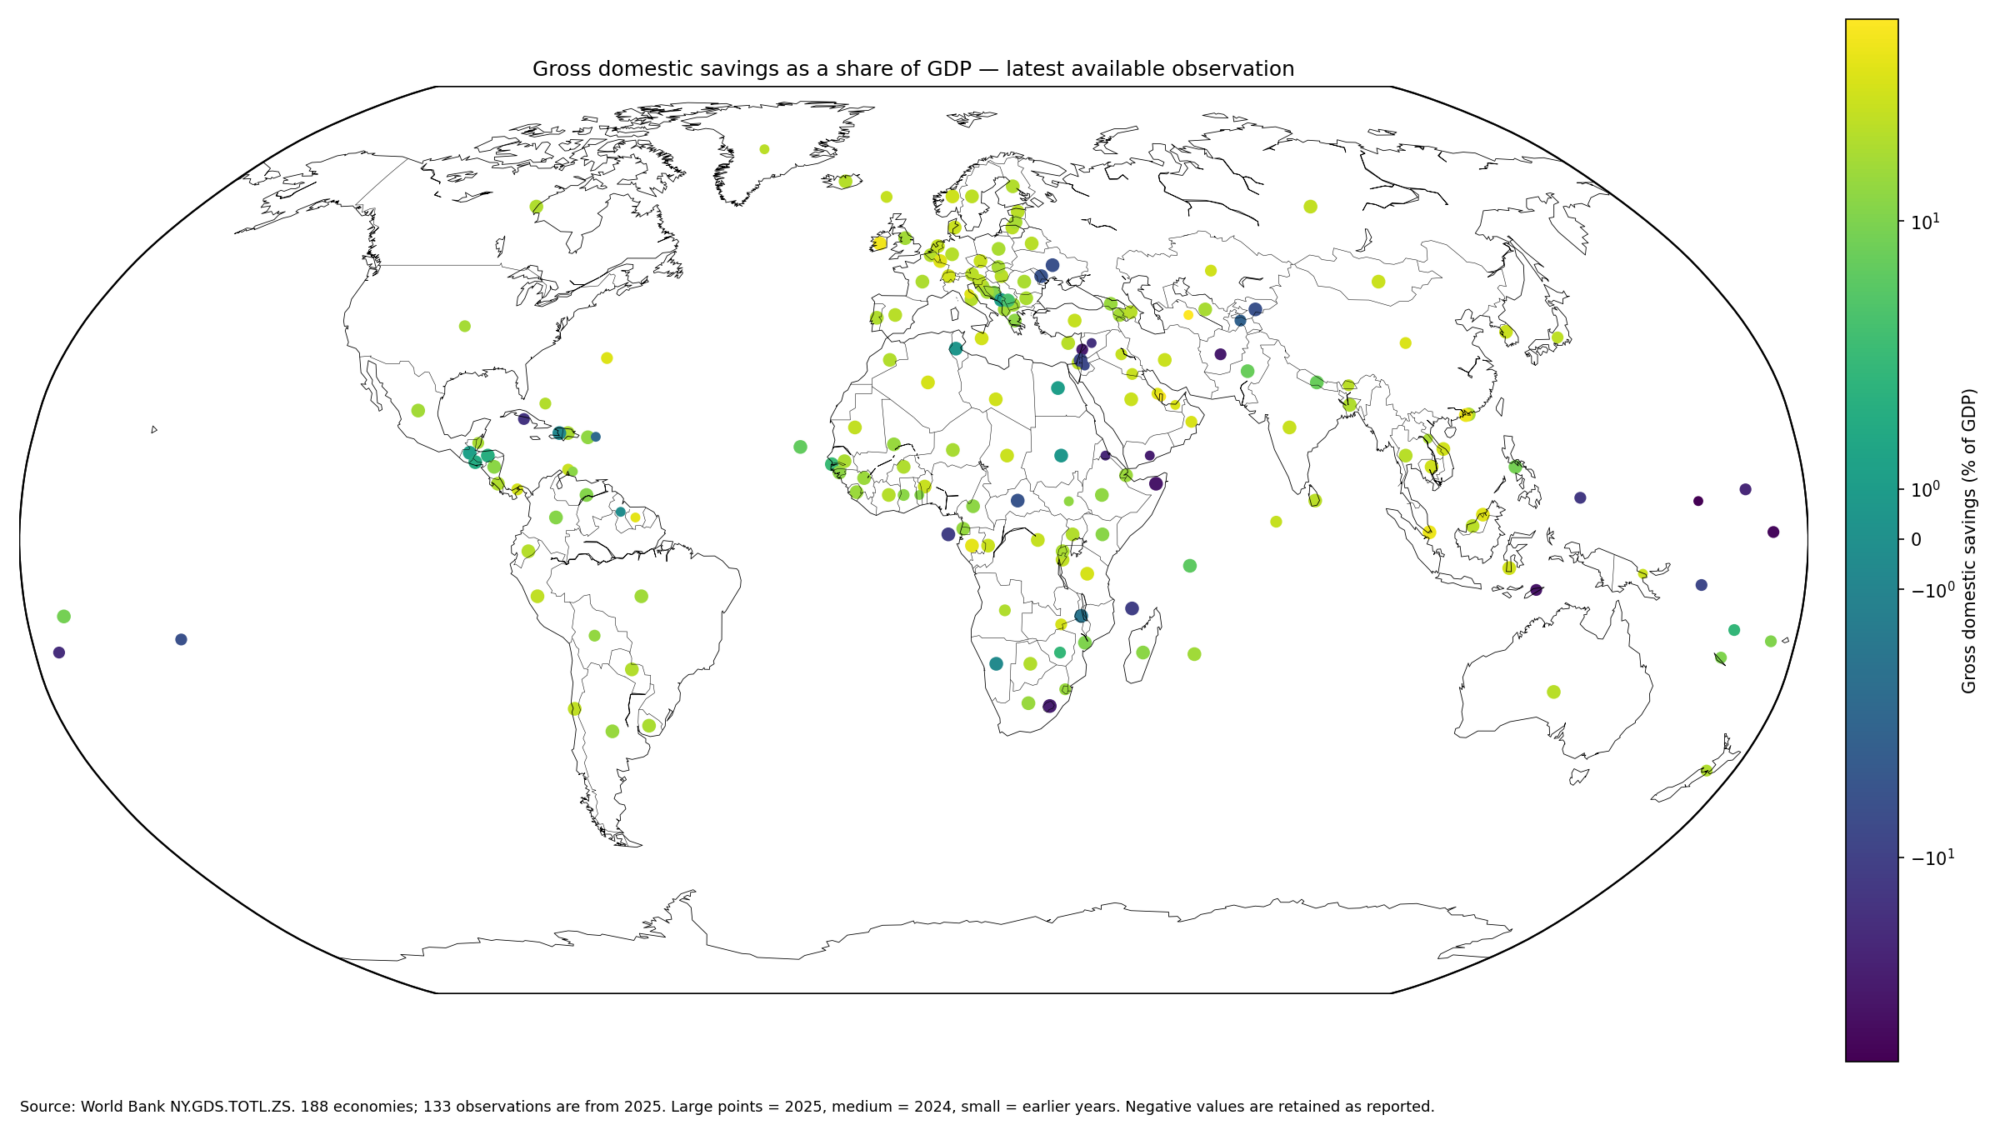
Mapping only the 2025 observations shows positive growth spread across most regions. Several economies in Africa and Asia are in the higher growth bands, but neighboring or nearby economies often fall into very different categories. Europe also contains both small positive rates and a few declines. This mix makes a simple continent-versus-continent interpretation unreliable.
The map groups values into below 0%, 0–2%, 2–4%, 4–6%, 6–10%, and 10% or more. Using bands prevents one very high observation from compressing the visual scale for everyone else. Economies without a 2025 value remain missing rather than being filled with zero. A blank area therefore means no usable 2025 observation in the joined data or no matching shape in the simplified geometry.

Why latest available data should not be mixed with a 2025 ranking
The source extract contains 176 economies because it keeps the most recent non-empty observation for each economy. However, only 133 of those rows are actually from 2025. Another 30 are from 2024, and 13 are from 2023 or earlier. This distinction matters whenever a headline or chart is explicitly about 2025.
One striking example is Eritrea, whose latest available observation in the file is from 2011 and is exceptionally large. Placing that old value next to 2025 observations would create a mathematically sorted list but not a meaningful same-year comparison. For this reason, the article preserves the older rows as source coverage information while excluding them from the 2025 ranking and visuals.
How this differs from household and government consumption
Final consumption expenditure is the combined total, so it can hide offsetting movements between major components. Household and nonprofit consumption may accelerate while government final consumption slows, or government services may expand while household demand weakens. Looking at the component series alongside the total helps explain why countries with similar final-consumption growth can have very different underlying stories.
The measure is also different from GDP growth. GDP includes final consumption, investment, inventory changes and net exports. A country can therefore post strong consumption growth while overall GDP grows more slowly if investment or net exports weaken. Conversely, GDP can expand rapidly even when consumption is subdued if other expenditure components are strong.
Practical cautions when comparing countries
First, annual growth rates are sensitive to the previous year’s base. A rebound after a contraction can look unusually large even if the longer-term path is moderate. Second, constant-price national accounts are periodically revised, so historical growth rates can change when statistical agencies update methods or source data. Third, total consumption growth is not the same as per-capita consumption growth because population can change at a different rate.
Fourth, missing 2025 values should not be replaced automatically with older observations and presented as if they refer to the same year. Fifth, country rankings can exaggerate small numerical differences. The median and interquartile range are often more informative for understanding the center of the distribution than the exact position of economies separated by only a few tenths of a percentage point.
Source: World Bank World Development Indicators, indicator NE.CON.TOTL.KD.ZG. The source file provides the latest non-empty value by economy; the same-year comparisons in this article use only rows dated 2025.
Frequently Asked Questions
Is final consumption expenditure growth the same as household consumption growth?
No. Final consumption expenditure is broader and combines major final-consumption components, including household and government consumption. The component series can move differently from the total.
Does a negative growth rate mean consumption itself is negative?
No. It means the real level of final consumption expenditure fell compared with the previous year. The expenditure level itself is not negative.
Why are all 176 latest observations not included in the 2025 ranking?
Because the reference years differ. Only 133 rows are dated 2025; the rest are from 2024 or earlier, so mixing them would not be a same-year comparison.
Related Articles
Green Map creates custom-edited map images using open geographic data sources such as geoBoundaries, Natural Earth, OpenStreetMap, and government open data. These maps are edited visual materials, not raw data files, and are provided for education, documents, presentations, and graphic reference.