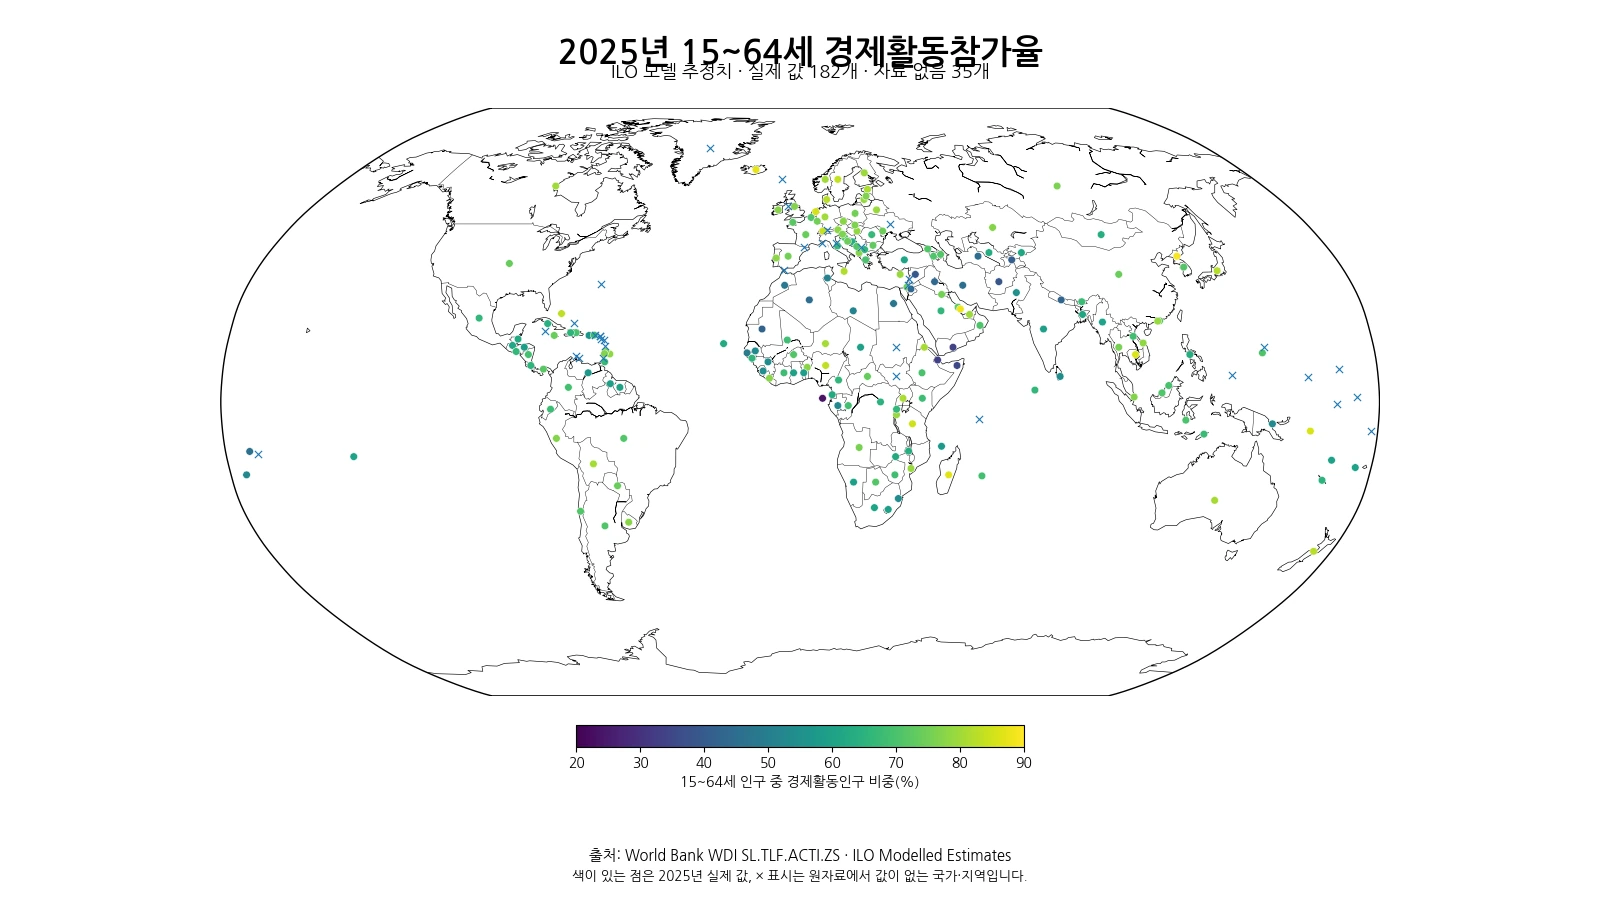
Education spending can look very different once it is scaled to national income rather than compared in absolute currency. The World Bank series Adjusted savings: education expenditure (% of GNI) places current education operating expenditure against gross national income. Across the 200 economies in the latest-observation dataset, the median is 3.90% of GNI. The middle half of observations falls between about 2.84% and 5.01%, while the highest observation reaches 23.63%.
The definition matters. This series covers current operating expenditure in education, including wages and salaries, but excludes capital investment in buildings and equipment. It therefore should not be treated as a complete measure of every form of education investment. It also uses GNI, not GDP or total government expenditure, as the denominator. Those distinctions explain why apparently similar education-spending percentages from other databases may not match this series.

Table of Contents
What this percentage actually measures
A share of GNI is a relative measure. It does not tell us which country spends the largest number of dollars on education. Instead, it asks how large current education operating expenditure is compared with the income earned by residents of the economy. A large economy can spend a great deal in absolute terms and still record a moderate percentage, while a smaller economy can record a high percentage with a much smaller absolute budget.
The indicator appears within the World Bank’s adjusted-savings framework because education expenditure is treated as relevant to the formation of human capital. That accounting context does not turn the percentage into a direct measure of education quality. Test performance, teacher availability, completion rates, class size, access and equity are separate outcomes that require other data. This series is about the scale of current education expenditure relative to GNI.
The observation year is unusually consistent
Of the 200 economies in the dataset, 199 use 2021 observations. The only exception is Yemen, whose latest non-empty observation is 3.60% in 2018. This makes the comparison much closer to a same-year cross-section than many latest-value datasets, although Yemen should still be treated separately in any fine-grained ranking.
Keeping the year visible is useful because both education expenditure and GNI can change over time. A shift in the ratio can come from the numerator, the denominator or both. The dataset by itself does not identify why a country’s ratio changes, so the analysis here stays with the observed levels and distribution rather than assigning causes that are not contained in the source data.
A small group sits far above the rest
The highest latest observation is Micronesia, Fed. Sts. at 23.63% of GNI. Cuba follows at 13.01%, then Marshall Islands at 12.74% and American Samoa at 11.76%. Only 4 of the 200 economies are at or above 10%. Those few double-digit observations create a long upper tail and make the maximum look very distant from the typical country.
| Rank | Economy | Observation year | Education expenditure (% of GNI) |
|---|---|---|---|
| 1 | Micronesia, Fed. Sts. | 2021 | 23.63% |
| 2 | Cuba | 2021 | 13.01% |
| 3 | Marshall Islands | 2021 | 12.74% |
| 4 | American Samoa | 2021 | 11.76% |
| 5 | Solomon Islands | 2021 | 9.94% |
| 6 | Botswana | 2021 | 9.48% |
| 7 | Virgin Islands (U.S.) | 2021 | 9.36% |
| 8 | Namibia | 2021 | 8.92% |
| 9 | Puerto Rico (US) | 2021 | 8.62% |
| 10 | Guam | 2021 | 8.32% |

A high position in this table should not be converted into a ranking of education-system performance. The ratio does not say how efficiently funds are used, how evenly they are distributed, or what students achieve. Economies can reach similar percentages through very different combinations of income levels, staffing costs, enrollment structures and public-private financing arrangements, none of which is fully described by this single series.
The typical range is much narrower than the maximum suggests
The median is 3.90% and the interquartile range runs from 2.84% to 5.01%. In other words, half of the 200 observations lie within a band a little over two percentage points wide. There are 52 economies at or above 5%, 10 at or above 8%, and 23 below 2%. The distribution is therefore much more concentrated around the middle than the highest values alone would suggest.

The mean is 4.25%, somewhat above the median because the very high observations pull it upward. The 90th percentile is about 6.56% and the 95th percentile about 7.83%. This makes values around 8% clearly unusual within the dataset even though they are far below the maximum of 23.63%. Median and percentile information therefore gives a more representative sense of the distribution than the arithmetic mean alone.
Low values need the same caution as high values
At the lower end, French Polynesia records 0.50%, followed by New Caledonia at 0.54% and Nigeria at 0.85%. These numbers simply indicate a smaller current education-expenditure share relative to GNI. They do not prove that education is a low priority, that public services are weak, or that households and private institutions play a particular role.
A low ratio can arise under many different institutional and economic settings. The denominator may be large relative to operating expenditure, financing may be recorded differently, or the composition of education spending may differ. The series does not separate those explanations. A country-specific assessment would need complementary measures such as expenditure per student, education as a share of government spending, enrollment and completion indicators, and the division between public and private financing.
Why GNI and GDP percentages are not interchangeable
Education finance is often reported as a share of GDP, a share of total government expenditure, or an amount per student. These are different metrics even when all of them appear as percentages. GNI adjusts domestic production for income flows between residents and the rest of the world, so a GNI-based denominator is not identical to GDP. Comparing this series with a GDP-based series without checking the denominator can create apparent discrepancies that are entirely definitional.
The numerator also deserves attention. Because capital investment in buildings and equipment is excluded, the measure focuses on current operating costs. A country undertaking a large school-construction program could therefore show a different pattern in a broader education-investment measure. The safest way to compare figures from different sources is to confirm the indicator definition, denominator, observation year and spending components before interpreting the numerical difference.
Ranges are often more useful than exact ranks
A ranking can make a difference between 3.8% and 3.9% look important even when both values are close to the center of the distribution. Broad bands such as below 2%, roughly 3%–5%, or above 8% are often more informative for understanding where an economy sits relative to the full sample. Because almost every observation is from 2021, those bands also reflect a relatively consistent point in time.
For trend questions, however, one year is not enough. A rising ratio might reflect higher current education expenditure, lower GNI, or both. A falling ratio does not necessarily mean that education spending was cut. Time-series analysis would need the numerator and denominator over several years, ideally together with enrollment and fiscal data, before a change could be interpreted confidently.
What to compare alongside this indicator
Several complementary measures answer questions that this series cannot. Education spending as a share of total government expenditure shows budget priority within the public sector. Spending per student gives a scale closer to the resources available for each learner. Enrollment, completion and learning indicators describe access and outcomes. Public-private spending measures help show who finances education. Combining those perspectives is more informative than treating a single GNI ratio as a scorecard.
Absolute and relative spending should also be kept separate. An economy with a modest percentage can still have a very large education system in absolute terms because its income base is large. Conversely, a high percentage in a small economy does not imply a larger total amount than a lower percentage in a much larger economy. The value of this indicator is that it normalizes current education expenditure by national income, not that it replaces all other measures.
Key points for reading the data
- 199 of 200 observations are from 2021; Yemen uses its latest non-empty value from 2018.
- The median is 3.90% of GNI and the middle 50% lies between about 2.84% and 5.01%.
- The maximum is 23.63%, creating a pronounced upper tail.
- The numerator covers current operating education expenditure, including wages and salaries, and excludes capital investment in buildings and equipment.
- The percentage should not be interpreted as a direct ranking of education quality, outcomes or efficiency.
Source and calculation
The source is the World Bank World Development Indicators series NY.ADJ.AEDU.GN.ZS. The comparison uses the most recent non-empty observation for each of the 200 economies. Rankings, the median, quartiles, percentiles and threshold counts were calculated directly from those observations. Missing values were not replaced with zero, and country percentages were not summed to create a world total.
The World Bank definition identifies the numerator as current operating expenditure in education, including wages and salaries and excluding capital investments in buildings and equipment. Values are expressed as a percentage of GNI. Those two features—the spending coverage and the denominator—should be checked whenever the series is compared with another education-finance statistic.
Frequently Asked Questions
Does this indicator include school construction spending?
No. The World Bank definition covers current operating expenditure, including wages and salaries, and excludes capital investment in buildings and equipment.
Does a higher share mean better education outcomes?
No. The percentage measures current education expenditure relative to GNI. It does not directly measure learning, access, quality or spending efficiency.
Are all observations from 2021?
Almost. 199 of the 200 observations are from 2021. Yemen uses its latest non-empty observation from 2018.
Related Articles
Green Map creates custom-edited map images using open geographic data sources such as geoBoundaries, Natural Earth, OpenStreetMap, and government open data. These maps are edited visual materials, not raw data files, and are provided for education, documents, presentations, and graphic reference.