UNESCO Institute for Statistics indicator MOGER.5T8.40530.GPIA measures the adjusted gender parity index for the mobile outbound gross enrolment ratio of tertiary students whose study destination is Central and Eastern Europe. The verified extract contains 188 national and territorial observations, all for 2023. GPIA is centered on 1, and UIS commonly treats values from 0.97 to 1.03 as gender parity.
The distribution is strongly tilted below that parity band. Of the 188 reported values, 139 are below 0.97, only 5 fall within 0.97–1.03, and 44 are above 1.03. The median is 0.467 and the mean 0.621. This indicates that the female-to-male relationship in this specific outbound mobility rate varies sharply by origin economy.

Table of Contents
How the adjusted gender parity index works
The ordinary gender parity index divides the female value of an indicator by the male value. UIS adjusts the index so that differences on either side of 1 are represented symmetrically and the theoretical range is bounded between 0 and 2. When the female value is no greater than the male value, the adjusted index is the female-to-male ratio. When the female value is higher, UIS transforms the ratio so that an equivalent gap above 1 is the same distance from parity as the corresponding gap below 1.
For this mobility indicator, a value below 1 should be described as a lower female value of the outbound gross enrolment ratio to this destination region relative to the male value. A value above 1 indicates the opposite direction. It is not appropriate to label one side automatically as better educational performance: studying abroad in one destination region is a mobility pattern, not a direct achievement score.
Only five observations fall inside the usual parity band
UIS commonly interprets 0.97–1.03 as gender parity. In this dataset, only 5 economies fall inside that interval: Hong Kong SAR at 0.979, Canada at 0.985, Zimbabwe at 0.988, Vanuatu at 0.993, and Liechtenstein at 1.019. The other 183 observations lie outside the narrow band.
More than half of all reported values are below 0.5: 100 economies fall in that range. This is a notable feature of the destination-specific mobility pattern, but it should not be generalized to all tertiary enrolment or all international study. The indicator is explicitly tied to outbound tertiary study directed to Central and Eastern Europe.

The highest values reach the upper bound of the adjusted index
Bahamas and Cayman Islands both record 2.000, the upper bound of the adjusted index. They are followed by Seychelles at 1.717, Gibraltar at 1.677, and Iceland at 1.676. A total of 6 reported economies are at or above 1.5. Values above 1 indicate a higher female value of this destination-specific mobility ratio relative to the male value.
| Rank | Economy | GPIA |
|---|---|---|
| 1 | Bahamas | 2.000 |
| 2 | Cayman Islands | 2.000 |
| 3 | Seychelles | 1.717 |
| 4 | Gibraltar | 1.677 |
| 5 | Iceland | 1.676 |
| 6 | Suriname | 1.561 |
| 7 | Norway | 1.481 |
| 8 | Croatia | 1.458 |
| 9 | Bhutan | 1.455 |
| 10 | Andorra | 1.440 |
These rankings should not be converted into absolute numbers of women and men studying abroad. GPIA is derived from sex-specific rates, while the number of students depends on population size and the underlying volume of tertiary mobility. A small economy can record an extreme parity index even when the absolute number of mobile students is modest.
Official zeros are different from missing data
At the lower end, Bermuda, Cook Islands, Curaçao, Marshall Islands and Solomon Islands are reported at 0.000. Tajikistan follows at 0.019, Uzbekistan at 0.062, and Haiti at 0.065. The five zeros are official source values, not missing observations that were filled with zero.
| Rank | Economy | GPIA |
|---|---|---|
| 1 | Bermuda | 0.000 |
| 2 | Cook Islands | 0.000 |
| 3 | Curaçao | 0.000 |
| 4 | Marshall Islands | 0.000 |
| 5 | Solomon Islands | 0.000 |
| 6 | Tajikistan | 0.019 |
| 7 | Uzbekistan | 0.062 |
| 8 | Haiti | 0.065 |
| 9 | Benin | 0.081 |
| 10 | Côte d’Ivoire | 0.084 |
A GPIA of zero should not be read as proof that no tertiary students from that economy studied in the destination region. The index summarizes the relationship between female and male values of the underlying mobility indicator. Determining the actual sex-specific counts or rates would require the underlying female and male series.
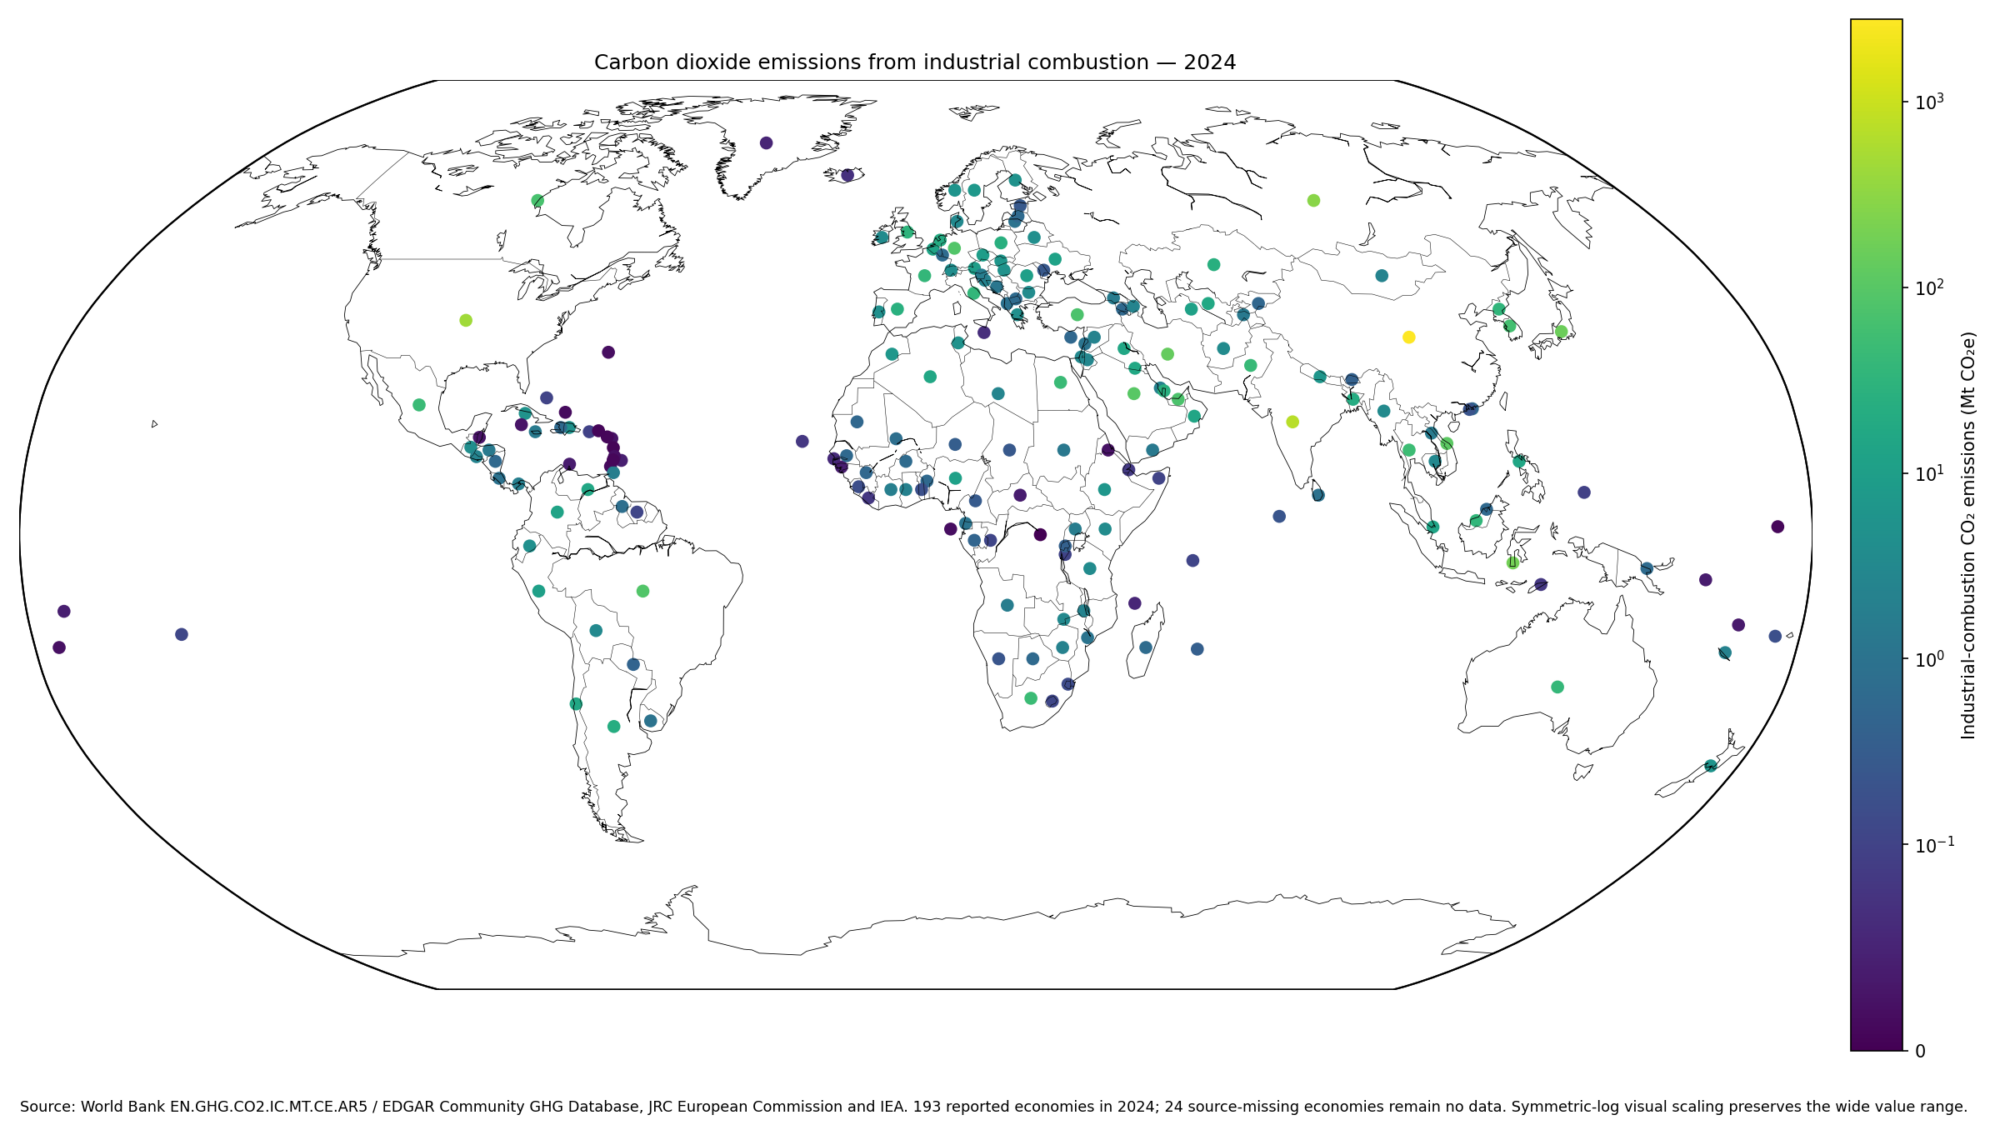
The world map is a map of origin economies
Country-code matching to a low-resolution world boundary layer produces visible polygons for 158 of the 188 reported observations, a match rate of about 84.0%. Some small states and territories have official values but no separate polygon in the base map. They remain in every ranking and summary statistic and are not treated as missing or zero.

The geography needs careful reading. The mapped countries are origins of internationally mobile tertiary students. Central and Eastern Europe is the destination category embedded in the indicator. A country in Africa, Asia or the Americas can therefore appear on the map because the statistic asks about students from that origin who study in the specified destination region.
Central and Eastern Europe is a destination category in this series
The indicator should not be mistaken for a map of gender balance inside universities located in Central and Eastern Europe. It measures outbound mobility from each origin economy toward that destination category. The published indicator name is therefore important context: the origin is the country row, while the destination is fixed by the series definition.
This article does not redefine the membership of the destination category. It follows the UIS indicator as published. A question about individual destination countries would require a dataset in which destinations are separated rather than aggregated into this regional group.
This is not the same as gender parity in all outbound study
Destination-specific mobility can differ from a country’s overall international study pattern. A country may be near gender parity across all tertiary study abroad but show a large gap for Central and Eastern Europe, or the reverse. The series therefore answers a narrower question than a general outbound mobility GPIA.
Potential explanations could involve programme availability, language, scholarships, costs, migration networks or bilateral education links, but none of those factors is included in this file. The data establish the pattern; they do not establish the cause.
Why a median below 0.5 needs careful interpretation
The overall median of 0.467 means that half of the reported GPIA values lie at or below that level. It does not mean that women make up 46.7% of all students studying in Central and Eastern Europe. The adjusted parity index is a transformation of sex-specific indicator values, not a direct student-share percentage.
The interquartile range runs from 0.267 to 0.986. The upper quartile is close to the parity center while the lower quartile is much farther below it, illustrating how broadly the distribution extends on the lower side of the index.
A country example should remain a peer comparison
Republic of Korea reports a 2023 value of 0.818. It is above the overall median of 0.467 but below the 0.97–1.03 parity band. That describes the female-to-male relationship for this specific route of outbound tertiary mobility; it does not summarize all international study or domestic tertiary participation.
What this indicator cannot tell us
- It does not provide the absolute numbers of female and male students studying in the destination region.
- It does not automatically describe gender parity across all international tertiary study.
- It cannot identify why a country is above or below parity without additional evidence.
- A higher or lower mobility rate should not be treated as a direct education-quality score.
- Economies without a reported observation must remain missing rather than being filled with zero.
Source and calculation
The numeric source is the UNESCO Institute for Statistics Data API for MOGER.5T8.40530.GPIA, with all reported observations referring to 2023. The adjusted GPI formula and the commonly used 0.97–1.03 parity band are described in UIS documentation on the adjusted gender parity index. UIS defines tertiary education as ISCED levels 5 to 8 in its tertiary education glossary.
Rankings, the mean, median, quartiles and parity-band counts are calculated directly from all 188 official observations. The five official zeros are preserved. Catalogue economies without a reported value are not imputed as zero. The world map joins source country codes to low-resolution Natural Earth geometry; unmatched small territories remain in the statistics but not as invented polygons.
Frequently Asked Questions
What does a GPIA of 1 mean?
It means the female and male values of this outbound tertiary mobility indicator are equal. UIS commonly uses 0.97–1.03 as a practical gender-parity band.
Does a GPIA below 1 mean there are fewer female students in absolute numbers?
Not necessarily. It means the female value of the destination-specific outbound mobility rate is lower than the male value. Absolute student counts require separate data.
Were missing countries filled with zero?
No. Five zeros are official source values. Economies without a reported observation remain missing and were not imputed.
Related Articles
Green Map creates custom-edited map images using open geographic data sources such as geoBoundaries, Natural Earth, OpenStreetMap, and government open data. These maps are edited visual materials, not raw data files, and are provided for education, documents, presentations, and graphic reference.